Software de gestión de proyectos que mantiene tu plan actualizado
Placker pone la programación, las dependencias y los reportes en los mismos tableros donde tu equipo ya trabaja, así el plan se mantiene fiel sin que nadie ande persiguiendo el estado.
Resumen rápido
Lo que Placker le da a un gerente de proyecto
Placker agrega la capa de programación y reportes que las herramientas de tableros no alcanzan a ofrecer:
- Dependencias en los cuatro tipos. Vincula tareas con todos los tipos de dependencia estándar, trazados directamente en el Diagrama de Gantt (Gantt chart).
- Ruta crítica cuando la necesitas. Activa la ruta crítica por tablero desde el menú del Gantt cuando necesites verla.
- Programación que reacciona. La programación automática funciona de forma flexible por defecto y estricta cuando lo necesitas, moviendo las fechas cuando una de ellas cambia.
- Reportes a partir del trabajo ya hecho. El progreso y el tiempo dedicado se registran solos a medida que las tarjetas se completan, así que los reportes se construyen a partir de lo que el equipo ya está haciendo.
- Un solo alcance impulsa cada vista. Los grupos de tableros reúnen varios proyectos en un solo alcance que alimenta el Gantt, los reportes y la vista de capacidad.
El problema
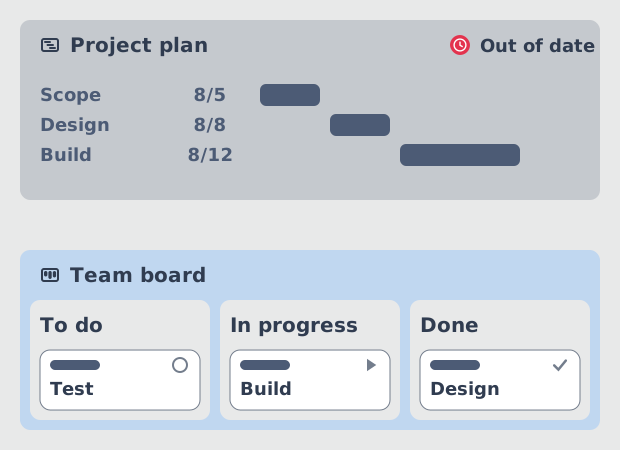
El plan es preciso el primer día y queda desactualizado para la tercera semana
La herramienta que le gusta al gerente de proyecto no es la que el equipo mantiene actualizada.
No te faltan opciones. La lista corta va desde herramientas de tableros que todos adoptan y con las que nadie puede planificar, pasando por plataformas de gestión del trabajo que exigen una migración antes de servir de algo, hasta suites de cartera que requieren toda una implementación. Lo que comparten es un mismo modo de falla. La capacidad que necesita un gerente de proyecto está en un extremo de ese rango y la capacidad que un equipo seguirá usando está en el otro, y la brecha entre ambas es donde el plan deja de ser cierto.
El Pulse of the Profession 2026 de PMI le pone números a lo que eso cuesta. Casi un tercio de los proyectos complejos, el 31%, no logra los beneficios que se propuso. Los equipos que manejan bien la complejidad reportan una tasa de éxito del 88%, frente al 14% de los equipos que batallan con ella. [VERIFY: PMI 2026 figures are quoted from PMI's official press release and corroborated across outlets, but were not read from the report PDF. Spot-check both figures against the PDF before publishing.] La complejidad es lo que hay que manejar. Una herramienta más pesada no es lo mismo que una mejor.
El enfoque
Agrega la capa de proyecto en lugar de migrar al equipo
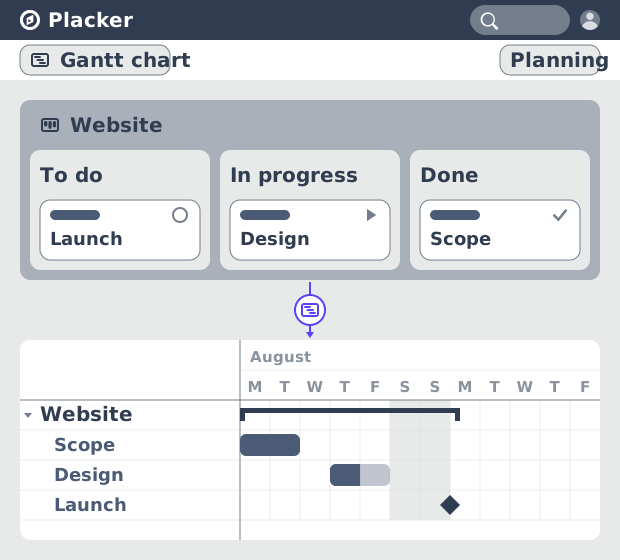
El tablero se queda donde ocurre el trabajo. El cronograma se apoya sobre esas mismas tarjetas.
Placker trata el tablero como el lugar donde el trabajo realmente ocurre, y coloca la maquinaria del proyecto por encima. Tu equipo sigue moviendo tarjetas. Obtienes fechas de inicio, dependencias, una ruta crítica, capacidad y líneas base sobre esas mismas tarjetas, sin un segundo sistema que reconciliar. No hay que volver a capturar nada, así que nada se desvía.
La diferencia se nota más entre proyectos que dentro de uno. Los grupos de tableros cargan varios tableros en un solo alcance, y cada vista lee ese alcance: el tablero, el Gantt, los reportes y el planificador. Un gerente de programa obtiene el estado entre proyectos sin comprar una suite de cartera, y sin pedirle a cada equipo que cambie su forma de trabajar. Ese es el argumento del empaque tanto como el del producto, porque las dependencias, las vistas de cartera y los reportes de verdad viven en los planes superiores de toda esta categoría.
Los pasos
Define las fechas, las dependencias y la ruta crítica
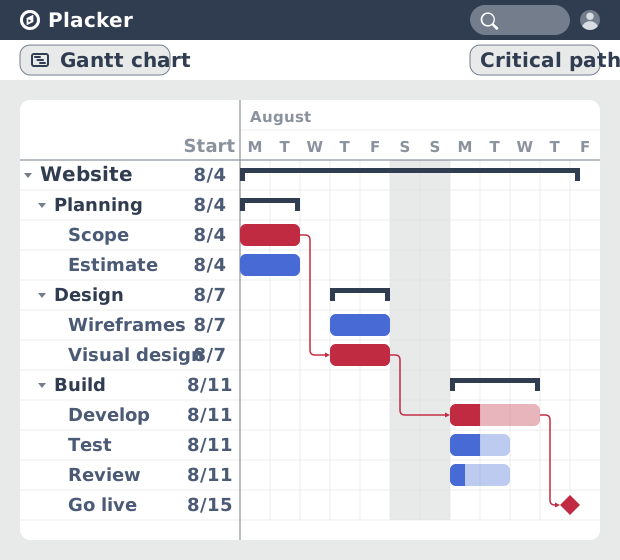
Cinco movimientos llevan un tablero de una lista de tareas a un cronograma que reacciona cuando algo se atrasa.
Todo lo que sigue funciona en la app web de Placker, sobre un tablero que ya importaste, y cada paso es un control del diagrama de Gantt. Síguelos en orden, porque las dependencias deciden las fechas del plan y la ruta crítica se calcula a partir de esas dependencias. Las fechas reales siguen viniendo del estado de la tarjeta y nunca se sobrescriben, así que el plan y el registro de lo que pasó se mantienen separados.
- Dale a cada tarjeta una fecha de inicio y una fecha de entrega
- Dibuja las dependencias en el diagrama de Gantt
- Agrega latencia donde el trabajo realmente la necesita
- Elige programación automática flexible o estricta
- Activa la ruta crítica
El resultado
Un plan siempre actualizado y reportes que no tienes que armar
El cronograma refleja el trabajo porque el cronograma y el trabajo son las mismas tarjetas.
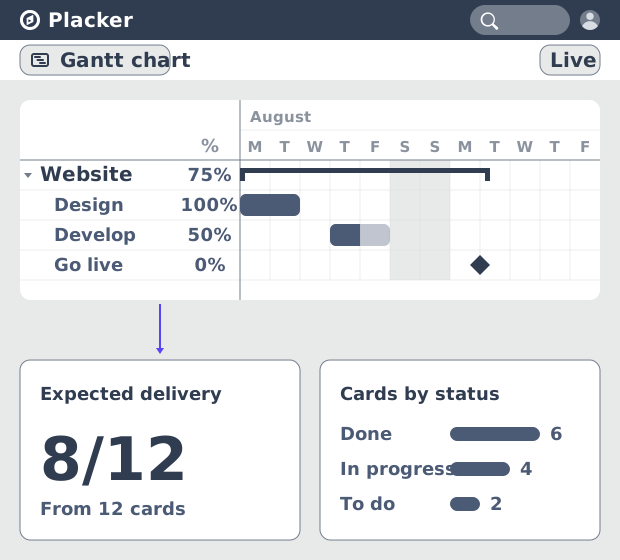
Ahora tienes un plan que sobrevive al contacto con la semana. Una fecha se mueve, las tarjetas dependientes se mueven con ella, y la ruta crítica muestra de inmediato si la fecha de fin se movió con ellas. A nadie hubo que pedirle una actualización de estado, porque Placker registró las fechas de inicio, las fechas de fin y el tiempo invertido conforme las tarjetas pasaban a completadas.
Esos mismos datos alimentan los reportes. La plantilla de seguimiento de progreso da el porcentaje completado, una fecha de entrega prevista y el conteo de tareas por estado. La plantilla de panorama del proyecto da el estado de los hitos, una gráfica de trabajo completado, una lista de riesgos y la carga de trabajo por miembro. Toma una línea base a tiempo y también podrás responder la pregunta que sigue a cada atraso, que es qué cambió frente al plan que acordaste.
Lo que tu software de gestión de proyectos debería mostrarte
Un plan que el equipo mantiene actualizado, un mismo alcance detrás de cada vista y reportes que lees en lugar de armar.
Un cronograma que reacciona cuando una fecha cambia
Mueve una tarjeta y las tarjetas dependientes se mueven con ella. El plan que presentas el lunes es el plan con el que trabaja el equipo, porque el tablero y el cronograma son el mismo conjunto de tarjetas.
Una ruta crítica que puedes señalar
La secuencia que podría retrasar la fecha de fin se muestra en rojo en el Diagrama de Gantt. Cuando una parte interesada pregunta qué está en riesgo, la respuesta está en la pantalla y no en tu cabeza.
Cada proyecto dentro de un mismo alcance
Un grupo de tableros (Board group) carga varios tableros de proyecto en una sola vista, y ese mismo alcance se abre en el Diagrama de Gantt, los reportes y el planificador. El estado entre proyectos deja de ser un resumen manual que rehaces cada semana.
Reportes que se arman solos
Placker registra las fechas de inicio, las fechas de fin y el tiempo dedicado a medida que las tarjetas se completan. Las plantillas de seguimiento de progreso y de resumen de proyecto leen esos datos, así que un reporte de estado se vuelve una vista que abres en lugar de un documento que escribes.
Consejos y buenas prácticas
Recomendaciones prácticas para aprovechar al máximo tu flujo de trabajo
Importa todos los tableros antes de programar cualquier cosa
Un grupo de tableros y un Gantt entre proyectos solo abarcan los tableros que ya están en Placker. Primero incorpóralos todos, o la vista de cartera tendrá huecos que no verás.
Desactiva la ruta crítica en tableros muy grandes
Placker revisa de nuevo cada tarjeta mientras la ruta crítica está visible. Actívala cuando estás planeando o replanificando, y desactívala cuando solo estás trabajando en el tablero.
Bloquea las tarjetas que no deben moverse
Los compromisos fijos, como una ventana de auditoría o una demo con un cliente, necesitan el atributo no programar automáticamente. Sin él, una reprogramación estricta los arrastrará junto con todo lo demás.
Toma una línea base antes de la primera solicitud de cambio
Una instantánea del plan original es la única forma de responder qué se atrasó y cuándo. Placker compara el plan actual contra ella más adelante, y no puedes capturarla de forma retroactiva.
Páginas relacionadas
Las capacidades detrás del plan, cada una cubierta a detalle en su propia página.
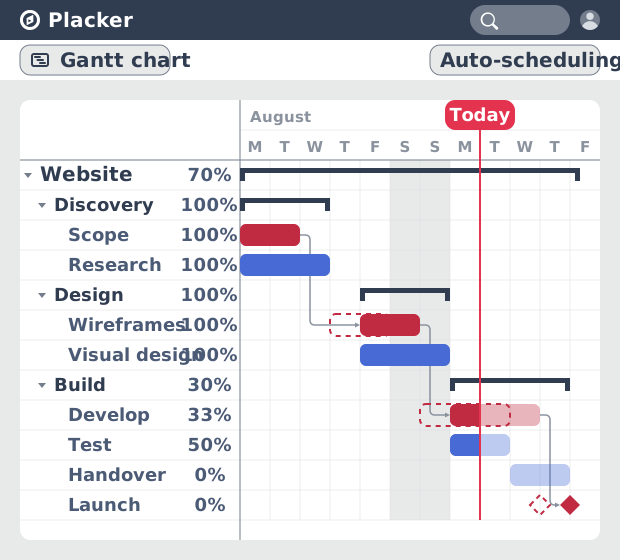
Diagrama de Gantt en Placker
Planea las tarjetas en el tiempo, traza las dependencias y ve el cronograma que el tablero está siguiendo en realidad.
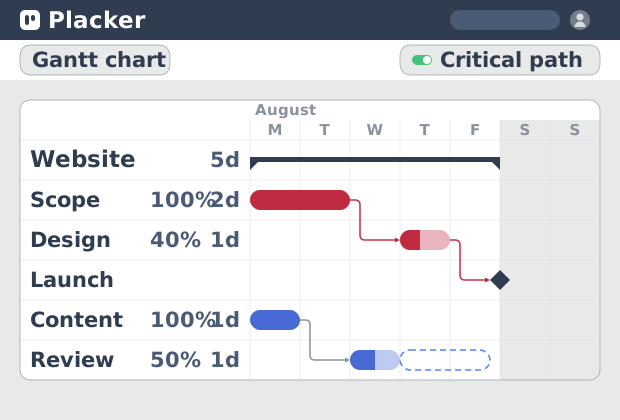
Ruta crítica en Placker
Encuentra la secuencia de tareas que decide la fecha de fin de tu proyecto y observa cómo cambia a medida que avanza el trabajo.
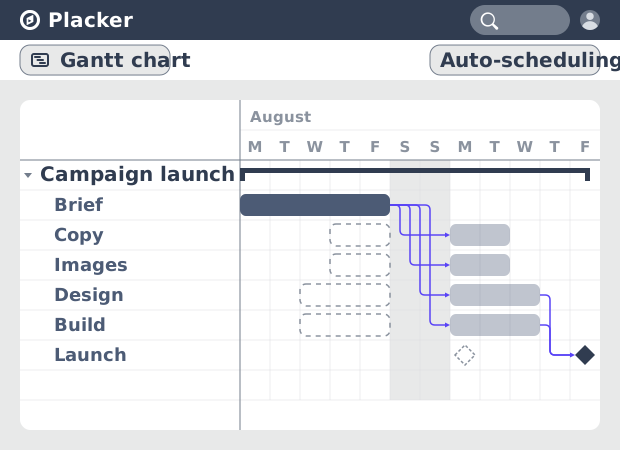
Programación automática en Placker
Modos flexible y estricto, y qué pasa con las tarjetas dependientes cuando cambia una fecha.
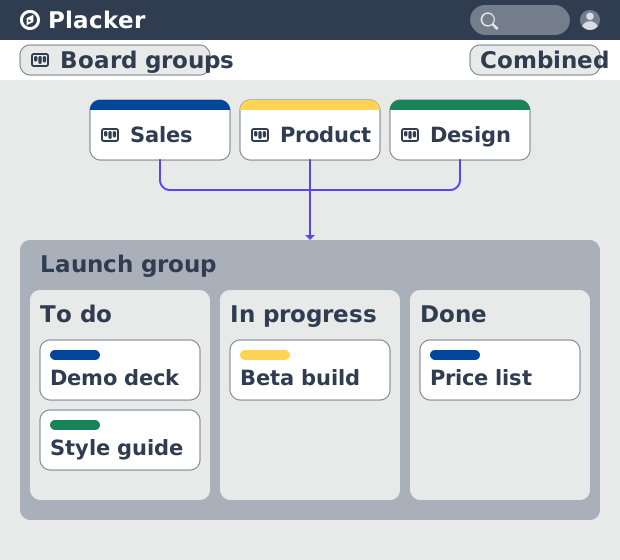
Grupos de tableros (Board Groups)
Carga varios tableros de proyecto en un solo alcance que el tablero, el Gantt y los reportes leen por igual.
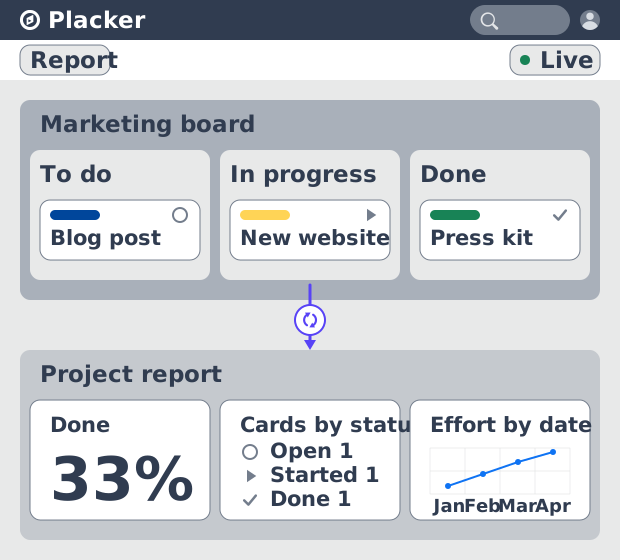
Reportes en Placker
Seguimiento de progreso y panorama del proyecto, construidos a partir de las fechas que tus tarjetas ya tienen.
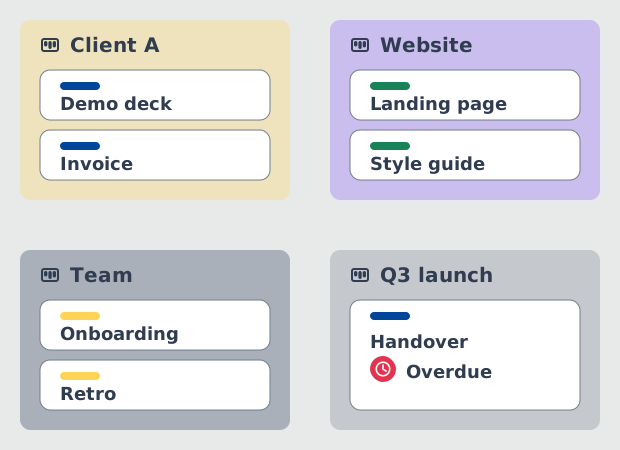
Crea un tablero principal
Reúne todos tus proyectos en una sola vista sin mover ni una tarjeta.
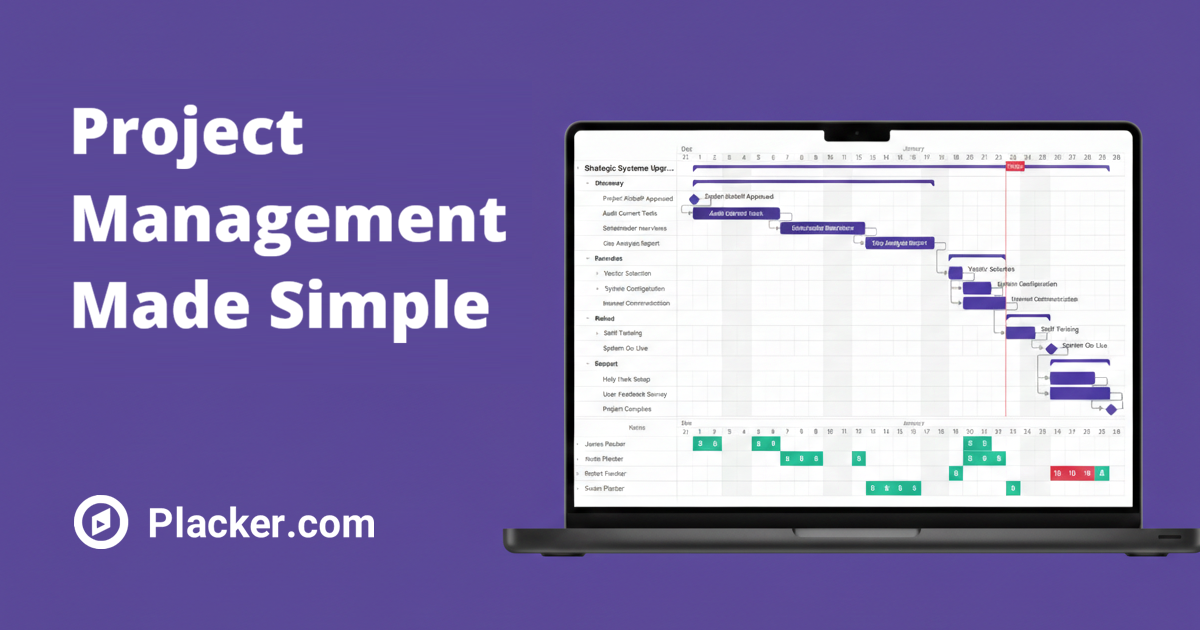
Gestión de proyectos para Trello
La misma capa de proyecto, descrita para equipos cuyos tableros ya viven en Trello.
¿Todo listo para comenzar?
Fácil de configurar, sin tarjeta de crédito. ¡Comienza tu prueba hoy mismo!