Build Trello dashboards and reports across every board
Trello shows one board at a time. Its native Dashboard view counts cards but stops there, with no cross-board roll-up, no pivot tables, and nothing to send on a schedule. Placker reads the boards you already run and turns their cards into live dashboards you can share.
Quick facts
Reports for Trello
Live Trello reporting across every board you run. Here is what you get:
- Ten boards, one picture. Pull cards from any set of Trello boards into a single portfolio dashboard instead of juggling ten open tabs.
- Charts a real review needs. Build KPI tiles, bar and line charts, pivot tables, card tables, and doughnut charts from live Trello card data.
- Up to date on its own. Every view updates automatically as cards move, labels change, and due dates pass.
- Shared in one click. Email a report to your team or client on a recurring schedule, or export any view to PDF in one click.
Cross-board reporting
Trello dashboards and reports that span every board
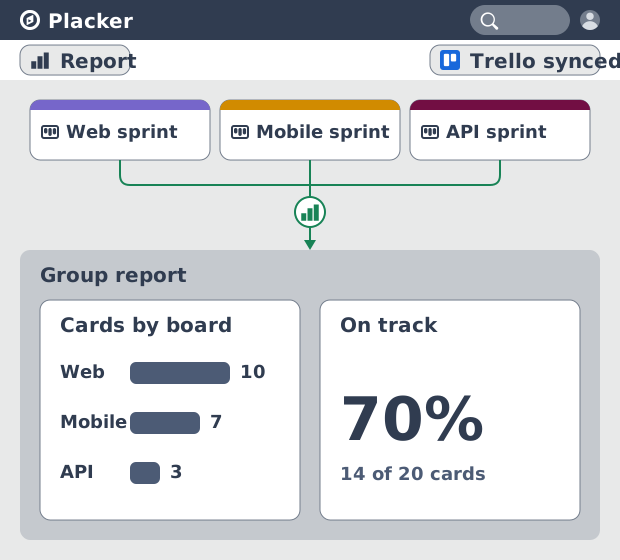
Board Groups combine the cards from any set of Trello boards into a single dashboard. That means you stop opening five boards and tallying cards by hand to brief a stakeholder. A product lead running separate sprint boards for web, mobile, and API sees overall progress in a single view, including the one board that is falling behind.
Widget charts
Turn card fields into the chart you need
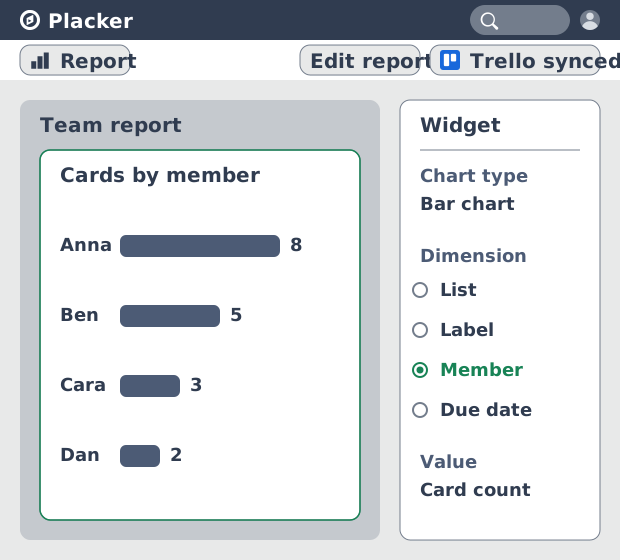
Inside that dashboard, each widget reads the Trello fields your team already fills in: lists, labels, members, due dates, and checklists. You point a widget at a field and get a chart, instead of exporting cards to a spreadsheet to make one. A bar chart by member shows who is overloaded; a pivot table cross-references status against label so a release owner can see which workstream is slipping.
Scheduled reports
Send the report instead of building it
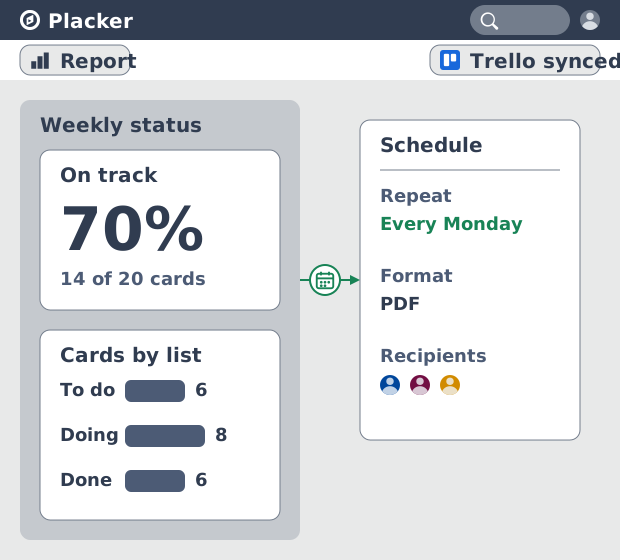
Once those charts and tables exist, they don't stay locked in the app. Recurring reports go out by email on a schedule, and any view exports to PDF. So the Monday status update stops being a copy-paste job into slides. A client services manager schedules a weekly PDF to each client and walks into the call with the numbers already sent.
How It Works
From a Trello board, the Report view is a few clicks away.
- 1
Enable Reports by Placker
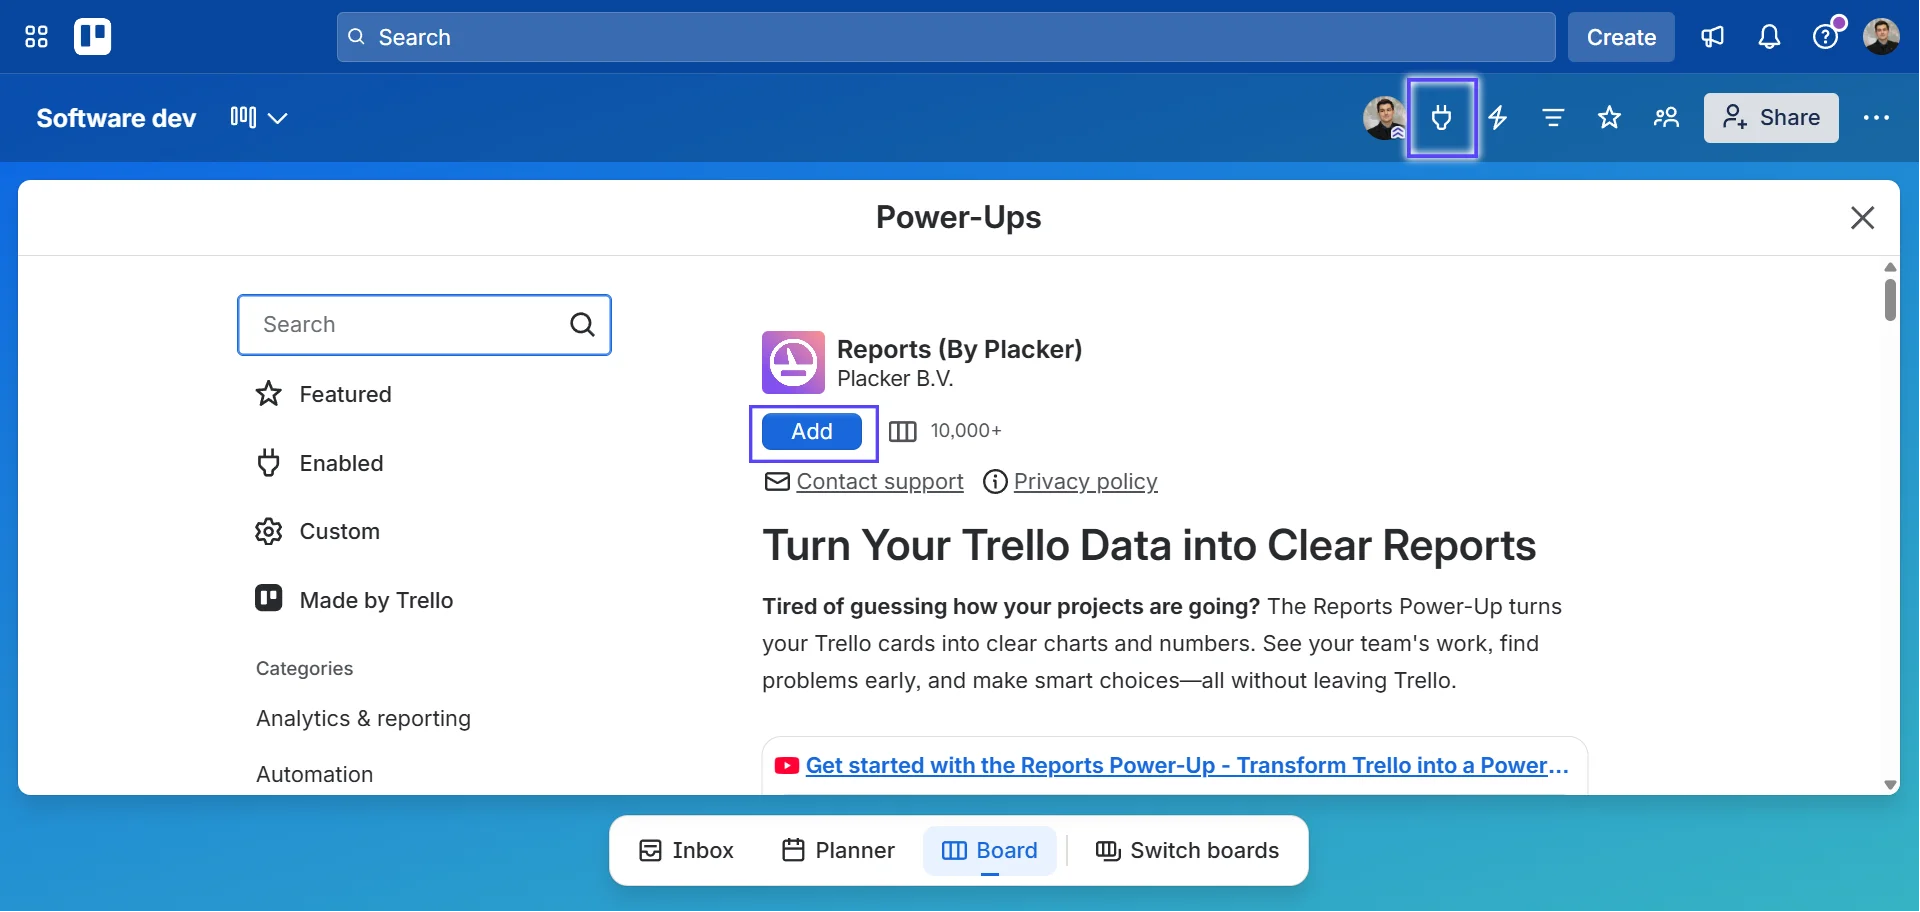
Open your board, click the Power-Ups (plug) icon in the top-right, search for "Reports by Placker," and add it.
- 2
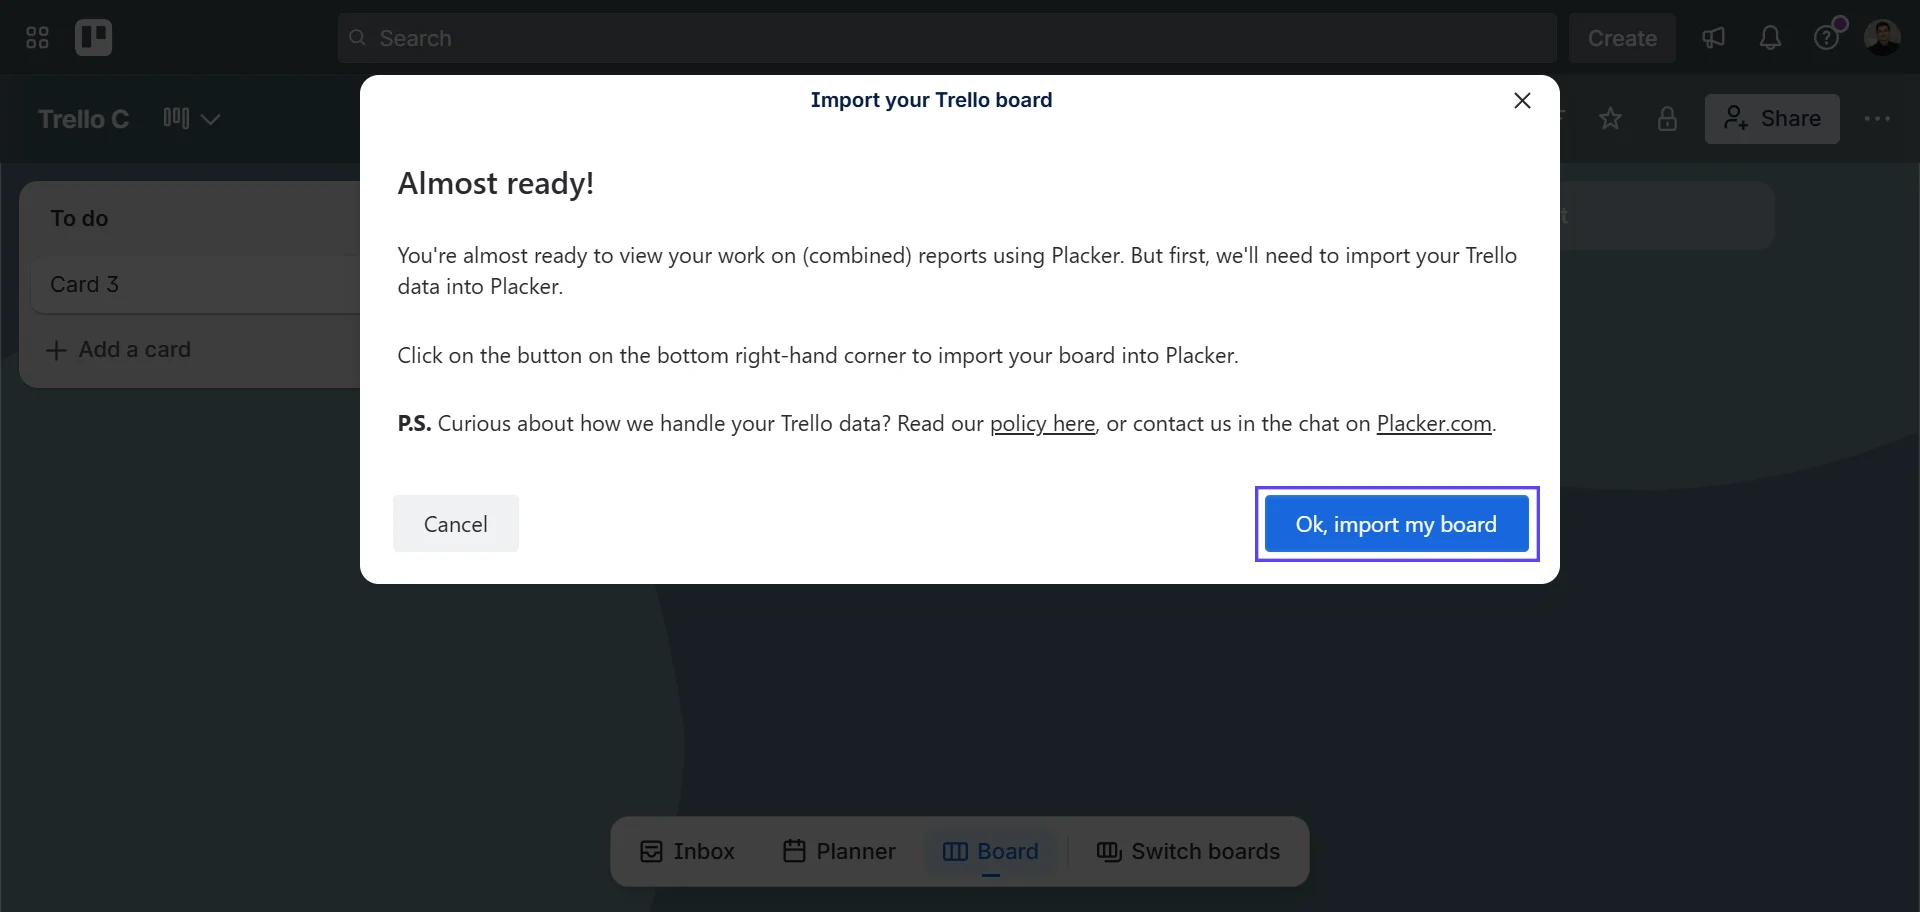
Import your board
Click the Report icon in the board menu, allow Placker to connect to your Trello account, and import the board you want to report on.
- 3
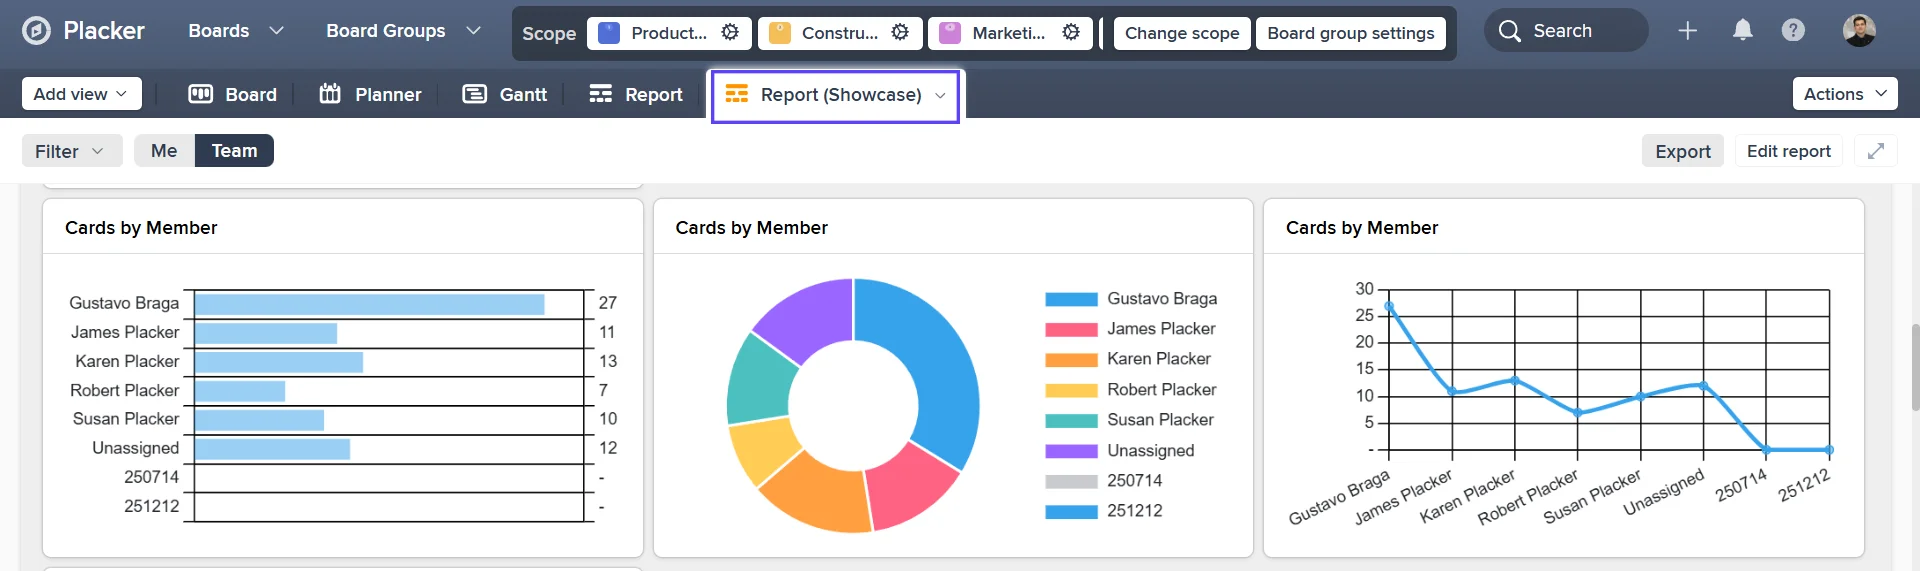
Build the dashboard
Open the Report view, then edit the showcase report: add the widgets you want, point each at a card field, and add filters to focus on a list, label, or member.
- 4
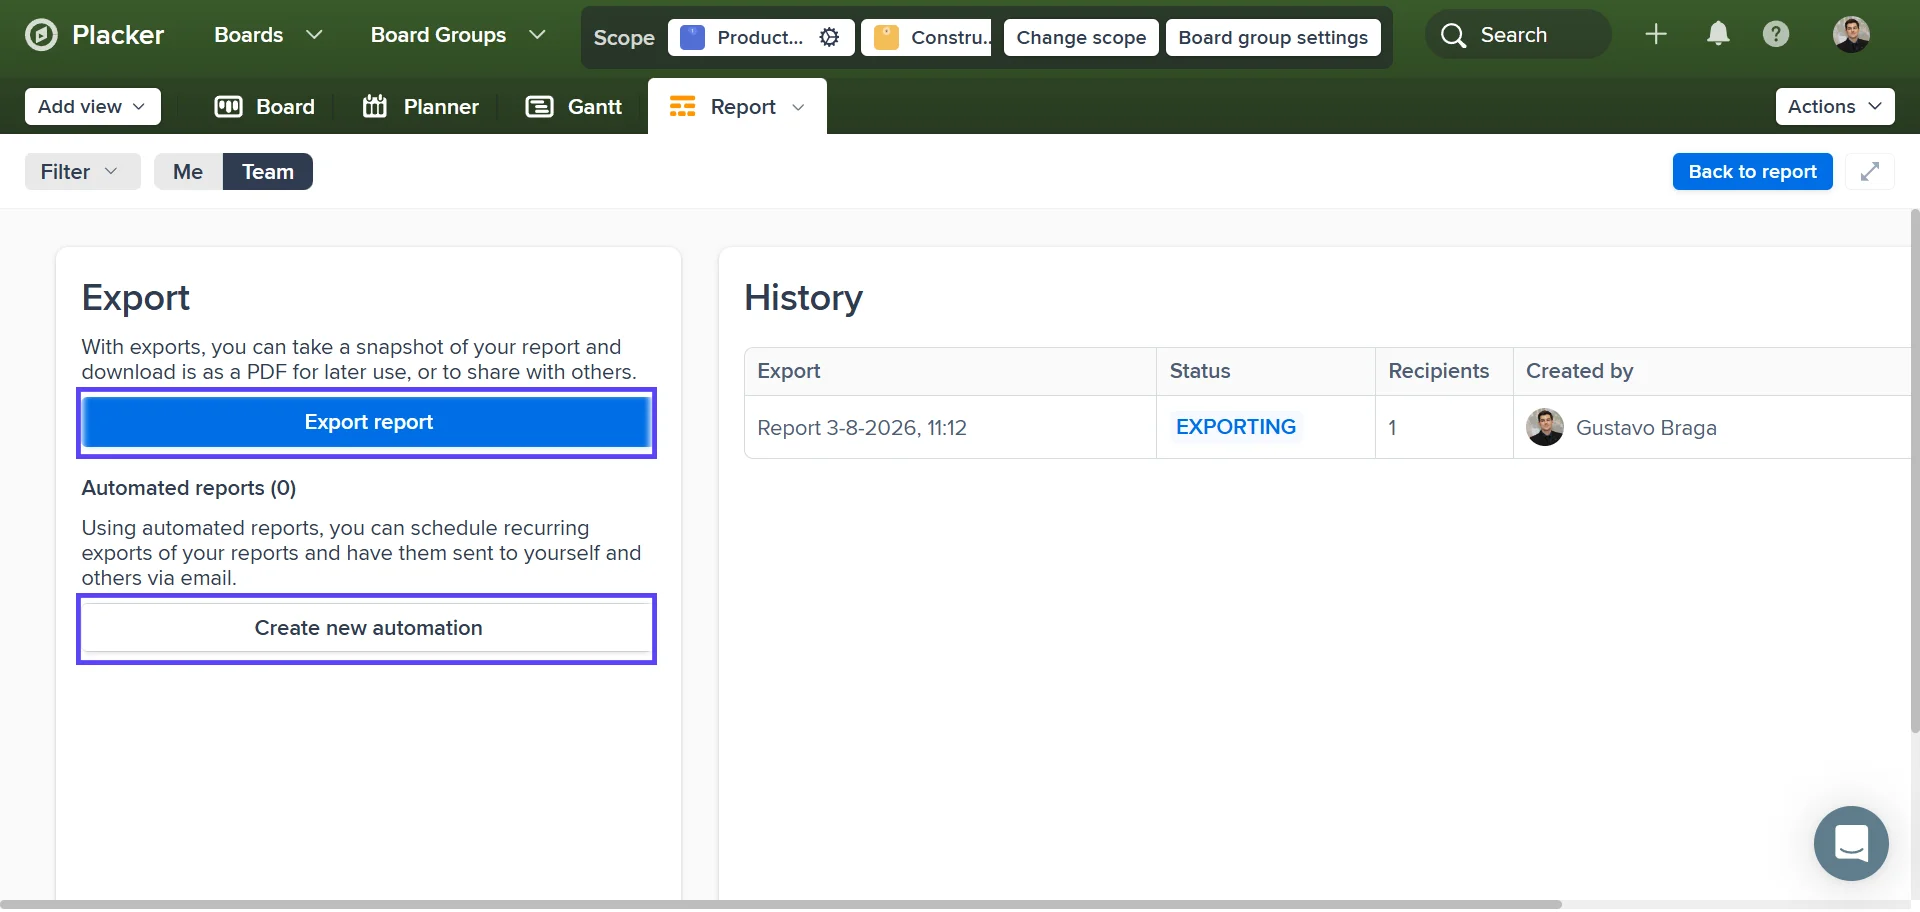
Share or schedule
Export the view to PDF, or set a recurring email under Automated reports so the report reaches your team or client on its own.
Use cases
See how teams use Placker's reports to track progress and make better decisions.
Software team on Trello
Tracks a sprint with a single-value tile for percent complete, a bar chart of bugs versus features, and a pivot table of estimated against actual effort by member, so workloads get adjusted mid-sprint.
Marketing team on Trello
Watches tasks by status across every campaign board and uses traffic-light widgets to spot which campaign is behind, then shifts people before a launch date slips.
Client services on Trello
Runs one board per client and schedules a weekly PDF to each, so reporting stops eating Friday afternoons.
Leadership reviewing Trello work
Monitors company-wide initiatives in one board-group dashboard instead of opening each team's board to ask where things stand.
Tips & Best Practices
Practical advice to get the most out of your workflow
Keep your report data clean with Automation rules
Reports are only as accurate as the card data behind them. Use Automation rules to apply labels, set due dates, and move cards consistently, so your dashboards and pivot tables stay reliable without manual cleanup.
Filter reports by Trello label to analyze a workstream or project
Use label filters to focus your report on a specific project, client, or phase. You'll get a clear picture of how work in that workstream is progressing without noise from other boards.
Build a separate dashboard for each audience
Set up one dashboard for your delivery team and a leaner one for clients or execs, each showing only the widgets that audience cares about. A focused view lands better than a single dashboard that tries to serve everyone.
Compare reports across sprints to track your team's velocity
Run the same report at the end of each sprint and compare results over time. Seeing trends in how many cards are completed, how fast tasks move, and where bottlenecks appear helps your team plan more accurately.
Related pages
Gantt chart for Trello
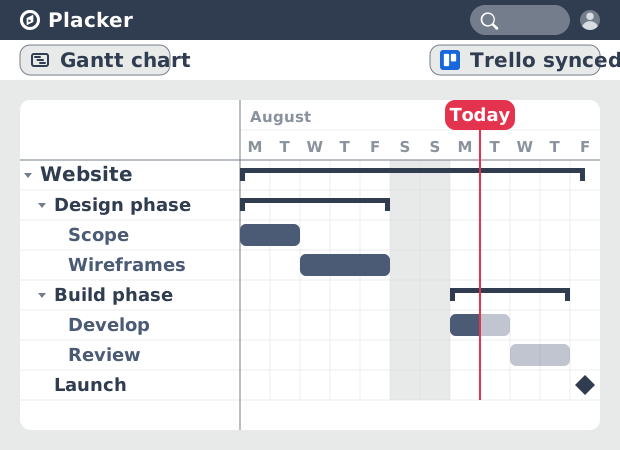
Add a real Gantt chart to your Trello boards. Placker turns cards with dates into a timeline with dependencies, critical path, and resource planning.
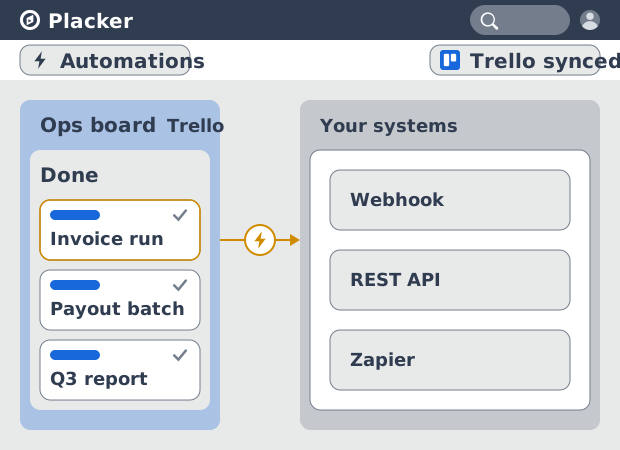
Trello integrations: two-way sync with Placker
Add two-way card sync, Google Calendar, Clockify time tracking, and webhooks to Trello with the Placker Power-Up. See how it works.
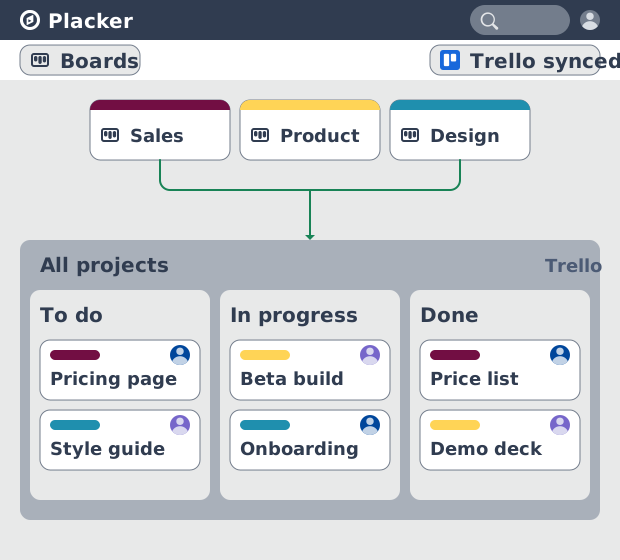
Trello board view: Kanban layouts and reports
Add Kanban structure to your Trello boards with Placker's board view. Group, swimlane, and report on the cards you already have. Add to Trello.
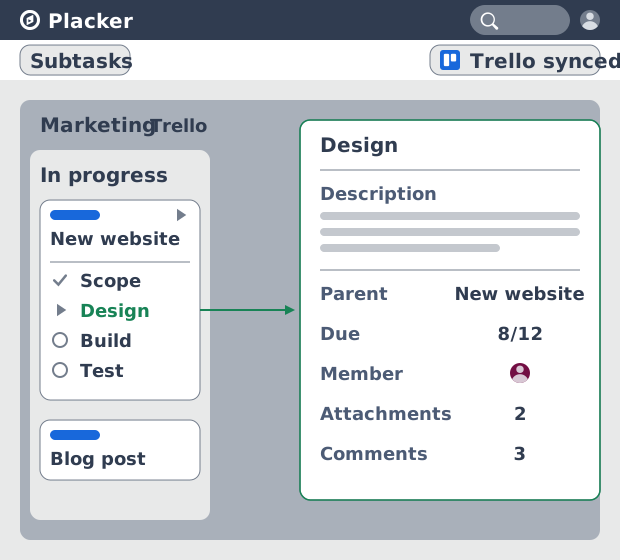
Trello Subtasks: Parent-Child Cards for Trello
Add real subtasks to Trello. Parent-child cards give each checklist item its own card and dates, and roll effort up. Add to Trello free.
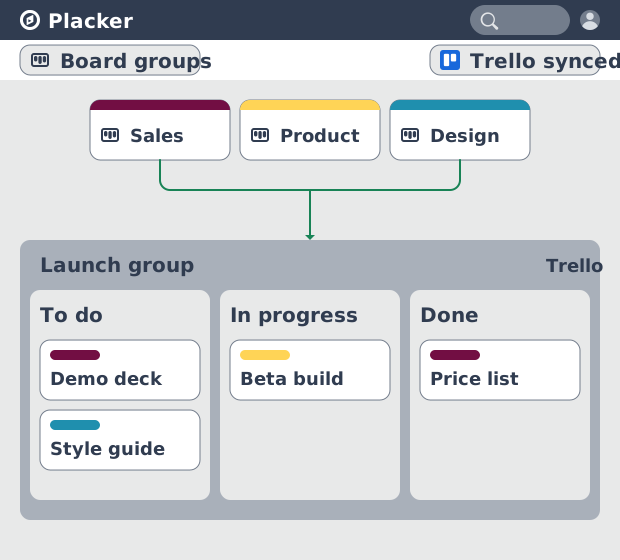
Board Groups for Trello: one combined board view
Load several Trello boards into one combined board view. Placker adds cross-board filtering, drag-and-drop between boards, and combine and split. See how.
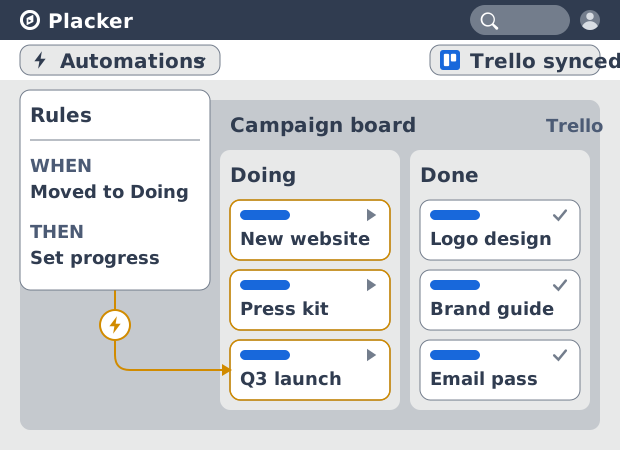
Trello automation rules: beyond Butler limits
Automate Trello boards with no monthly run cap. Placker rules mirror cards two ways and reach fields Butler can't. See how it works.
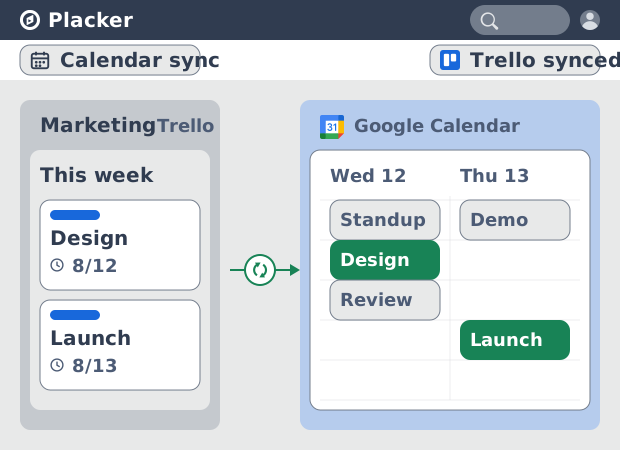
Trello Google Calendar sync: two-way & real-time
Sync Trello cards with due dates to Google Calendar both ways, in under a minute. Edit in either tool and the other updates. Add it to Trello.
Ready to supercharge your Trello boards?
Start your 15-day free trial today. No credit card required.