Resource planner that keeps you from over-committing the team
See who is overloaded before deadlines slip. Placker's Resource Planner shows committed hours per team member per day, flags overallocation in the Gantt, and calculates FTE across all your projects.
Quick facts
Resource Planner quick facts: Placker
See exactly where your team is overloaded, before it costs you a deadline:
- See who is overloaded, and on which day. The Resource Planner shows committed hours per team member per day from assigned cards and their effort estimates, and highlights overloaded days automatically when hours exceed capacity.
- Plan, actual, and remaining in one view. Placker tracks planned, actual, and remaining effort per card, and the Capacity Planning Report shows remaining effort across your full board history.
- FTE to validate your intake. The Capacity Planning Report divides planned effort by available capacity, so an FTE above 1.0 flags an overcommitted member. Split by label, list, or custom attribute to see where load concentrates.
- Capacity across boards and portfolios. The Resource Planner works across multiple boards via Board Groups and portfolio views, aggregating total load per member from every board in one place.
Committed hours
See committed hours and overallocation before deadlines slip
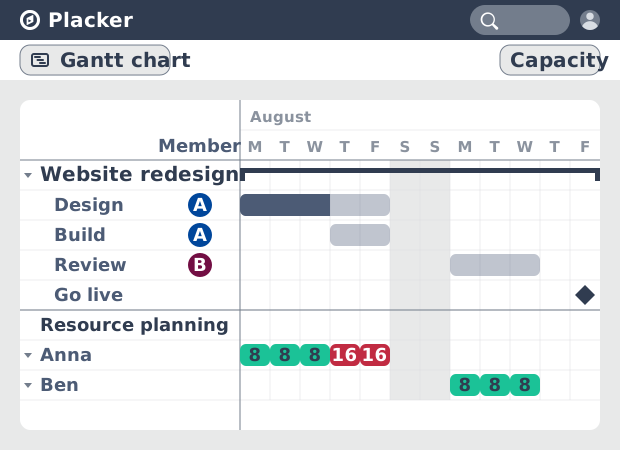
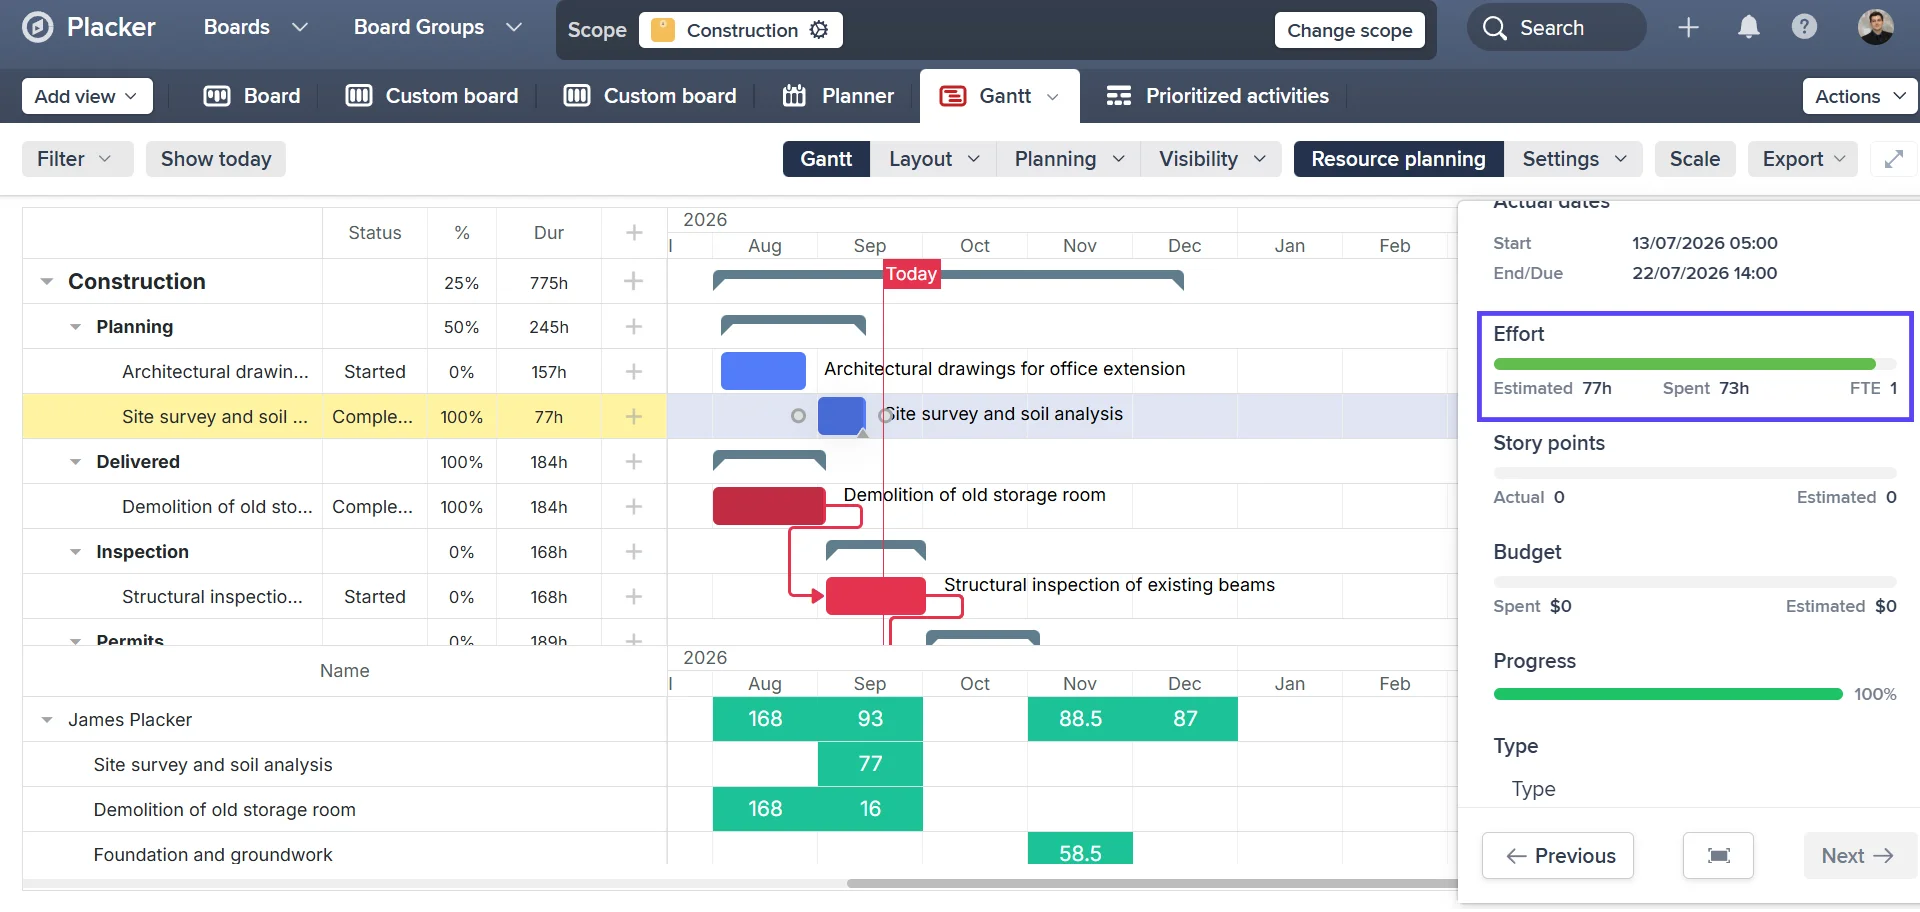
The Resource Planner in Placker's Gantt view shows assigned hours per member per working day. Members can be grouped by role or team name (configured in board settings), giving managers a team-level view alongside individual rows. When a member is assigned to multiple overlapping cards, the planner highlights the overloaded day.
The default allocation is 8 hours per card, but you can set individual effort estimates per card or per checklist item. Enable 'Show effort from checklist items' to display hours from individual checklist items for process-based boards where each step has a separate assignee. Workload imbalances that are invisible in a task list become visible before they cause delivery problems.
Screenshot of Resource Planner rows in Gantt view, showing overallocation highlighted on a member's row alongside the task bars.
FTE reporting
FTE-based capacity planning reports
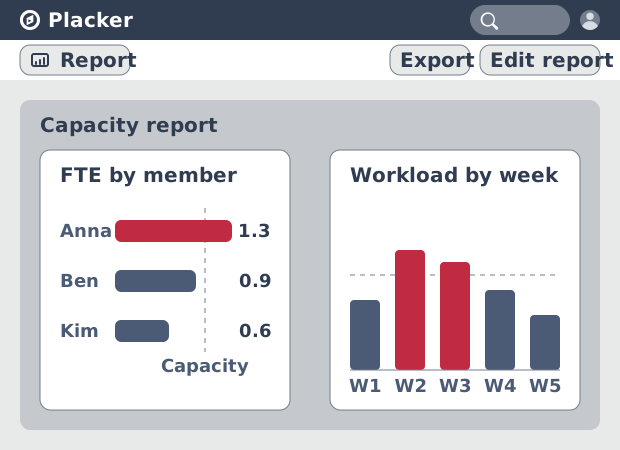
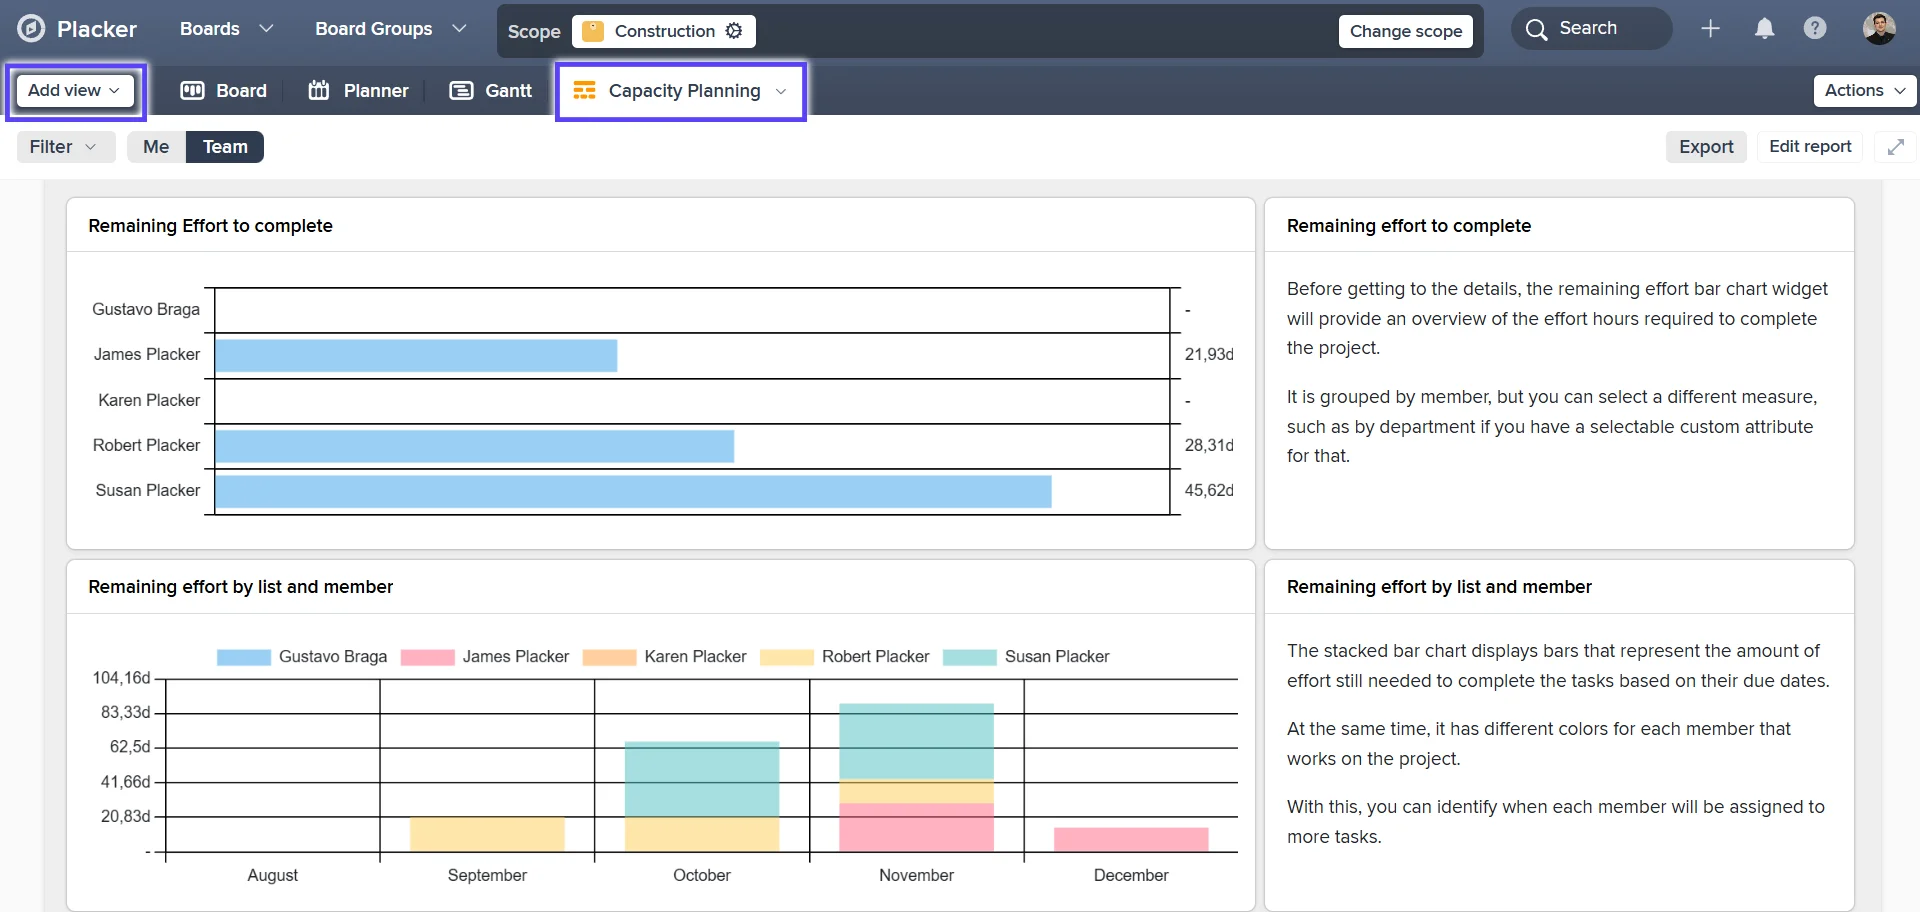
The Capacity Planning Report gives a workload view across your team over time. It includes a bar chart of remaining effort per member, a stacked chart of workload over time, and a pivot table of workload data. All calculations use the working hours and calendar settings you configure for your board.
FTE calculations per member per period (planned effort divided by available capacity) turn workload into a single comparable number. Split FTE results by label, list, or custom attribute to see where load is concentrated. When you need to make the case for additional headcount or reduced scope, FTE gives you a number to work with instead of an impression.
Screenshot of Capacity Planning Report showing FTE chart with members listed by workload, and the stacked workload-over-time chart.
Effort tracking
Plan, track, and improve estimates
Each card tracks three effort figures: planned effort, actual effort, and remaining effort. Three capacity management templates ship ready to use: Capacity Planning Report View, Resource Planner by Status, and Tasks by Member and Status. Apply any of them to your board without configuration.
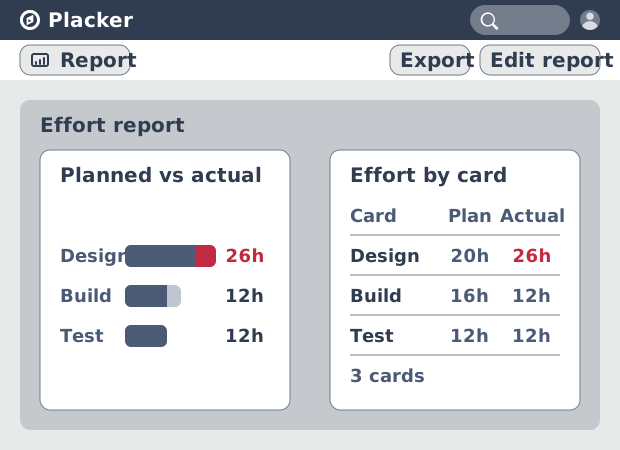
When actual effort is logged alongside planned, remaining effort shows in the Capacity Planning Report. The comparison between planned and actual closes the feedback loop on estimates. Your team's planning accuracy improves because you can see where estimates consistently ran over or under.
Screenshot of plan vs. actual effort comparison in Report view, showing remaining effort bars per member.
How It Works
See committed hours per person and rebalance work across boards, in four steps.
- 1
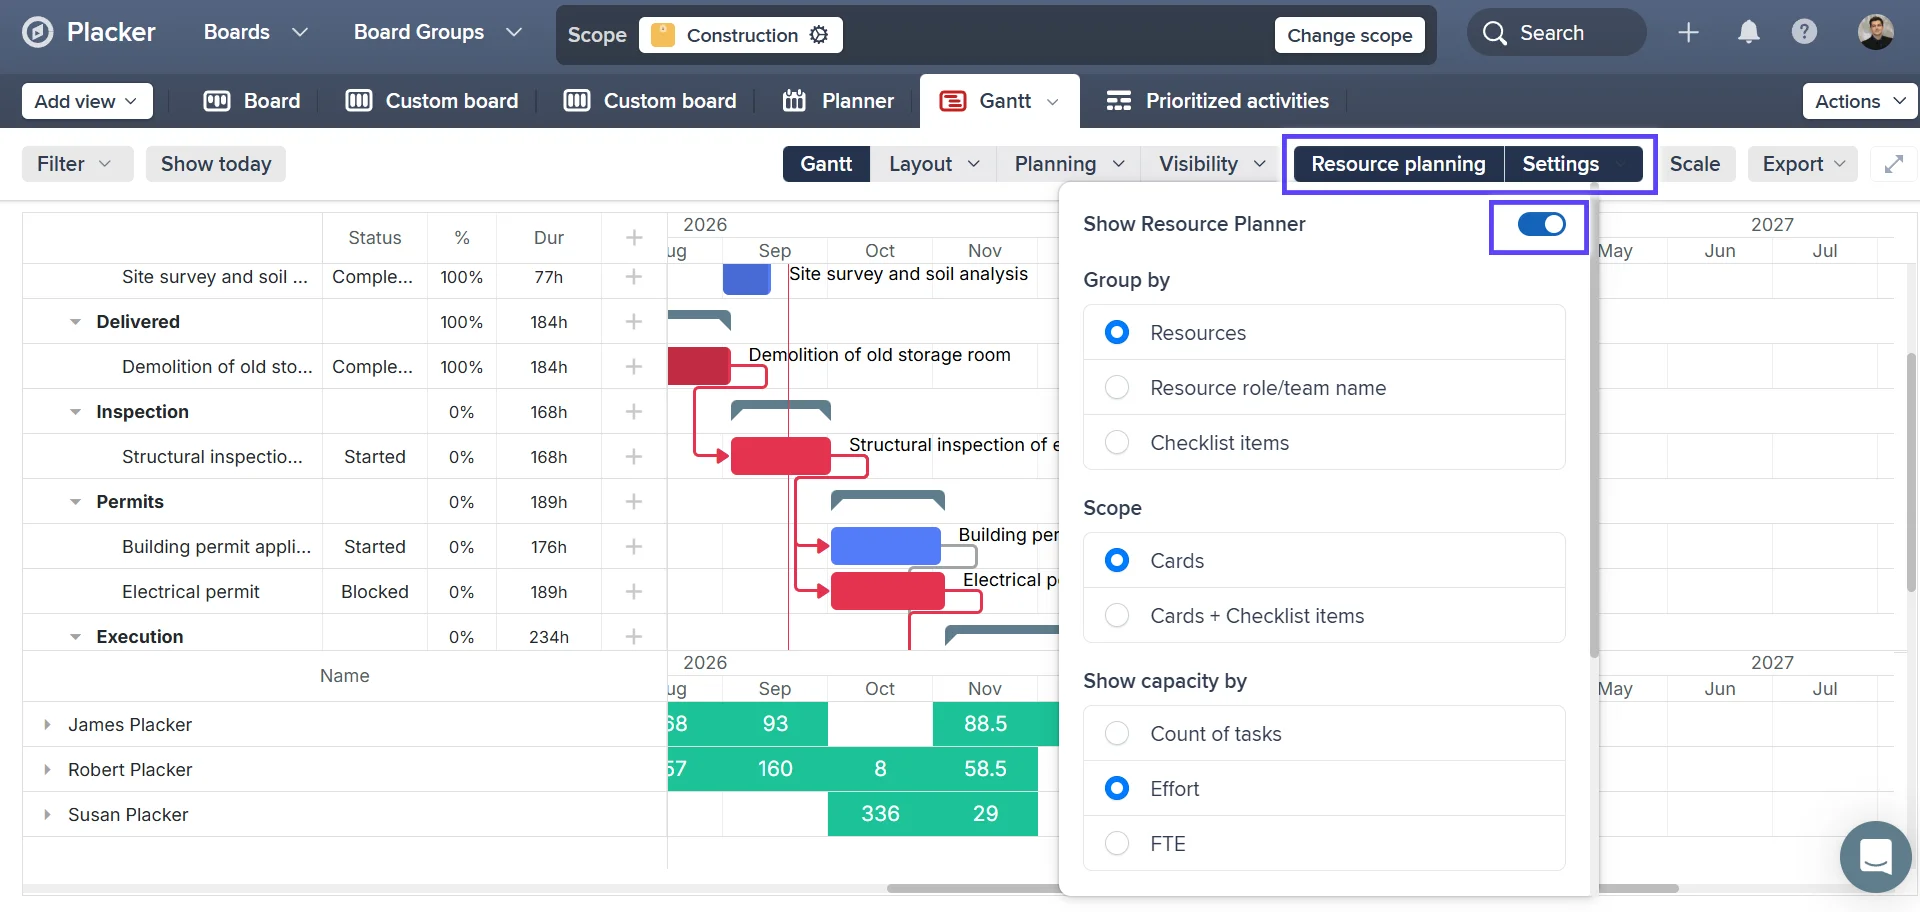
Enable Show Resource Planner in the Gantt view
Open Placker's Gantt view and toggle Show Resource Planner to see committed hours for each team member below the timeline.
- 2
Set effort estimates on cards
Add effort estimates to cards or checklist items. Placker combines these with your board's calendar settings — working hours per day, start time — to calculate load per day.
- 3
Review workload in the Capacity Planning Report
Open Report view and select a Capacity Planning Report to see it by member, workload over time, and remaining effort charts.
- 4
Combine boards with Board Groups
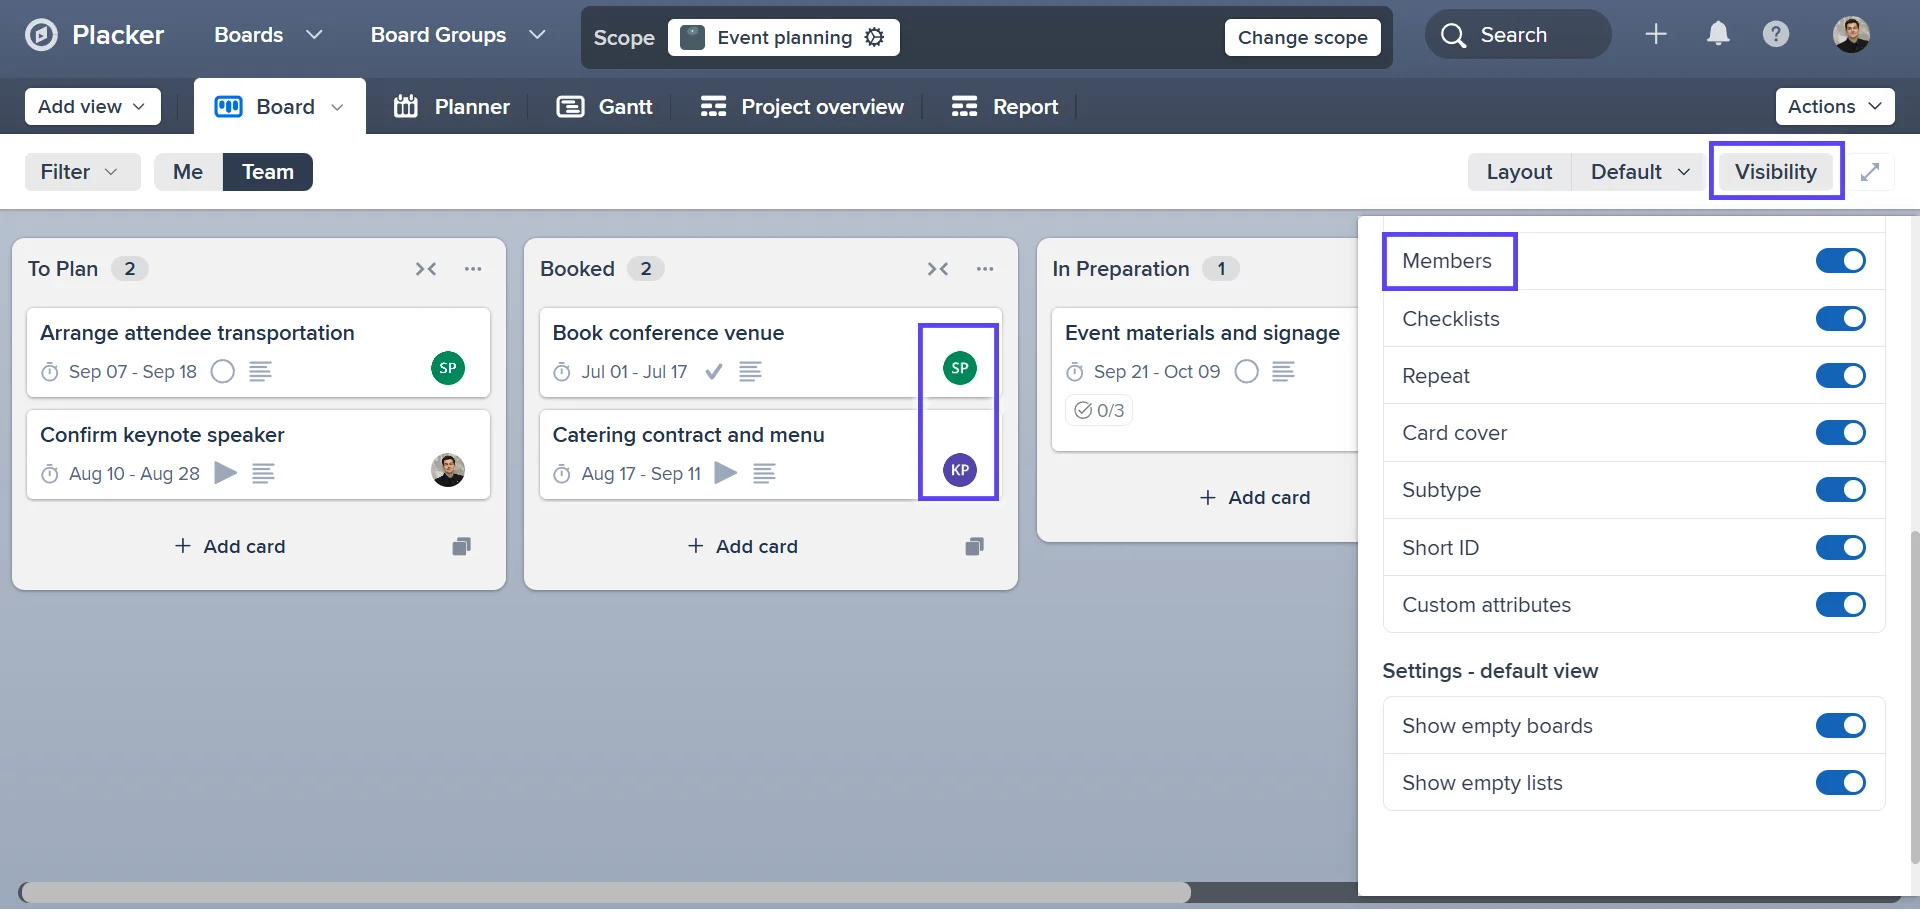
Use Board Groups or a masterboard to pull load data across multiple boards into a single resource view.
How It Works
1. Open Placker's Gantt view and toggle 'Show Resource Planner' to see committed hours for each team member below the Gantt timeline. 2. Set effort estimates on cards or checklist items. Placker uses these alongside your board calendar settings (working hours per day, start time) to calculate load per day. 3. Open Report view and select a Capacity Planning Report to see FTE by member, workload over time, and remaining effort charts. 4. Use Board Groups or a masterboard to pull load data across multiple boards into a single resource view.
Use cases
Where teams use the resource planner to balance workloads and avoid over-committing people.
Team manager with weekly capacity check
A team manager opens the Placker resource planner at the start of each week to see each person's scheduled task hours against their available capacity. Tasks are redistributed in under five minutes based on the actual numbers rather than assumptions about who has bandwidth.
Lead preventing overcommitment
A project lead uses the resource planner to flag team members who are allocated above 100% before committing to a new milestone date. The planner turns overcommitment from a discovery at the end of a missed sprint into a visible constraint at planning time.
Portfolio PM with cross-project allocation
A portfolio manager uses Placker's resource planner to see total hours committed per person across all active projects in the portfolio. New project intake is sized against the remaining capacity, preventing the portfolio from expanding faster than the team can absorb.
Tips & Best Practices
Practical advice to get the most out of your workflow
Use Resource Planner to spot overloaded team members before it is too late
Placker's Resource Planner shows each team member's workload over time, colour-coded by capacity. Check it before starting a sprint or assigning new work: a quick scan can prevent burnout and missed deadlines.
Drag tasks in Resource Planner to re-balance workload in seconds
When you spot a bottleneck, drag tasks between team members or adjust dates directly in the Resource Planner. Placker updates the assignment and dates instantly, with no need to open each card individually.
Use Resource Planner to plan capacity before committing to deadlines
Before promising a delivery date, open Resource Planner to see whether your team has the bandwidth to hit it. Visible capacity gives you the confidence to commit, or the data to push back.
Review Resource Planner weekly to catch issues early
Spend five minutes each Monday in Resource Planner to check what the week looks like. Catching an overloaded team member on Monday is much easier to fix than discovering it on Thursday when deadlines are close.
Related pages
Placker integrations: sync your project tools
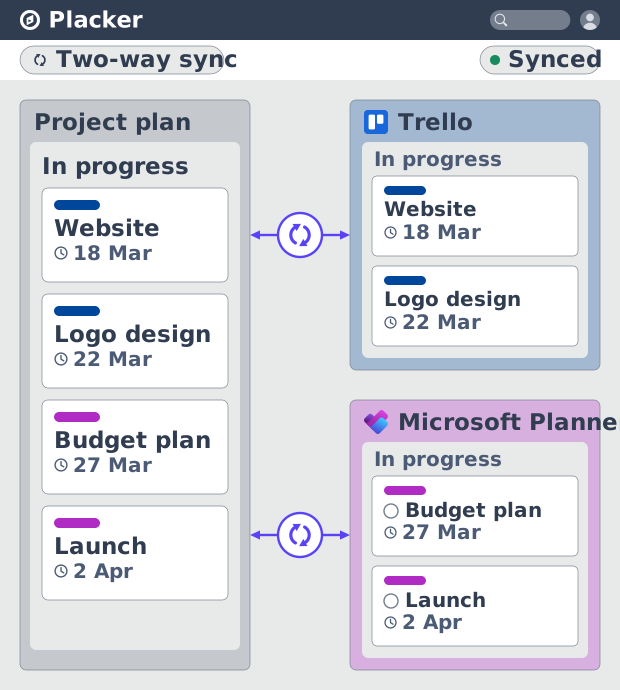
Placker integrations sync Trello, Microsoft Planner, Google Calendar, Clockify, and Zapier two ways, keeping one plan across every tool. See how it works.
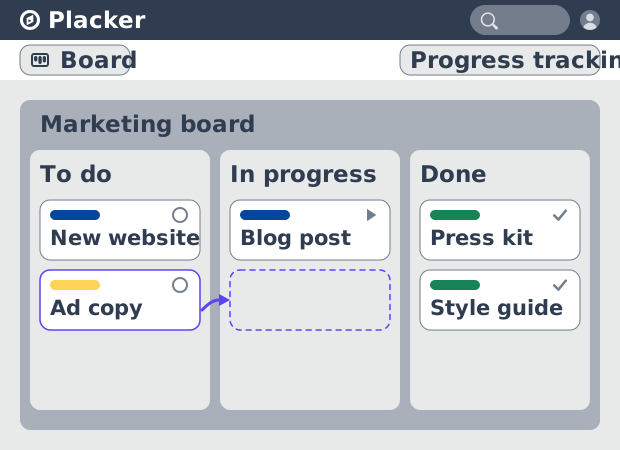
Board views: one board, any view
See all your work as cards moving across lists in Placker. Group by member, swimlane, or due date, and track flow with Kanban reports. See how it works.
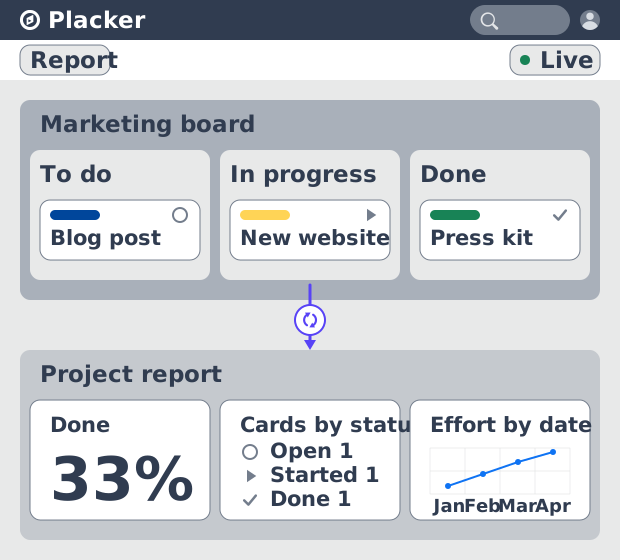
Project dashboards and reports
Build live project dashboards from your tasks. KPI widgets, pivot tables, portfolio roll-ups, and scheduled PDF reports. Start a free Placker trial.
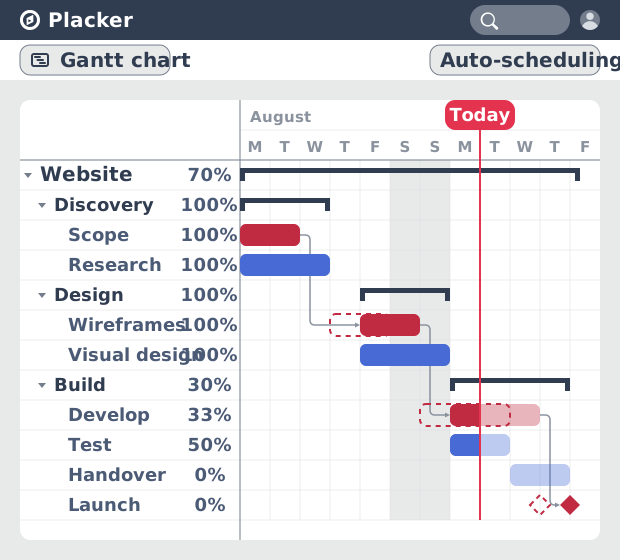
Gantt chart software with auto-scheduling
Plan projects on a visual timeline with Placker's Gantt chart software. Set dependencies, auto-schedule dates, and track the critical path.
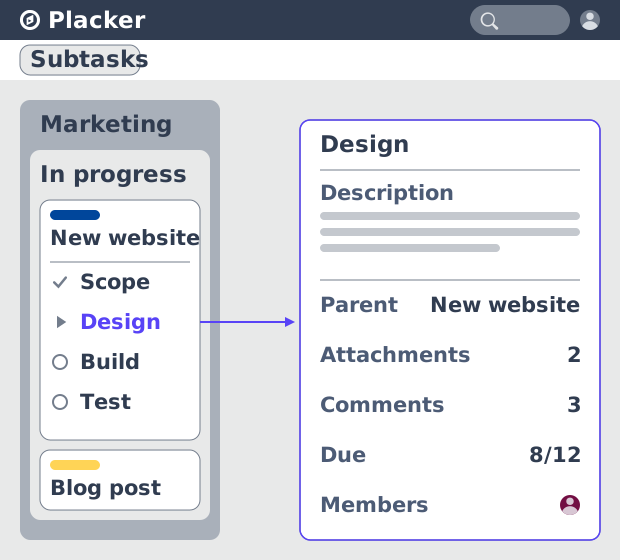
Parent-Child Cards in Placker | Subtasks that roll up
Parent-child cards in Placker give every subtask a full card and roll effort, dates and members up to the parent. Read the total on top.
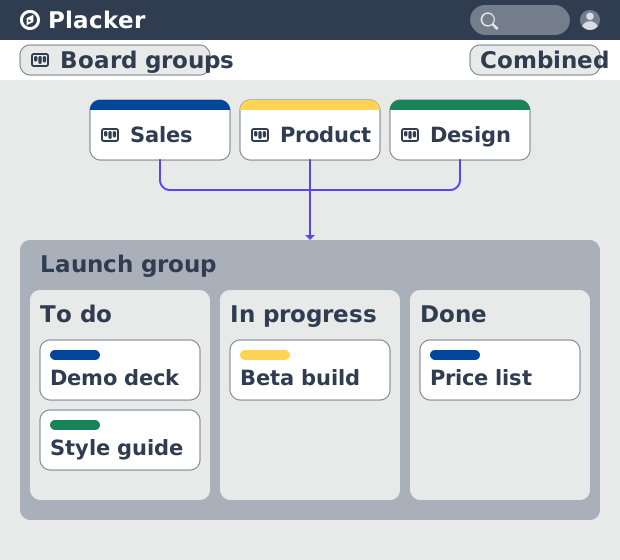
Board Groups: many boards, managed as one
Board Groups let you manage many boards as one workspace: plan, filter, and report across all of them, and save reusable groups. Start a free trial.
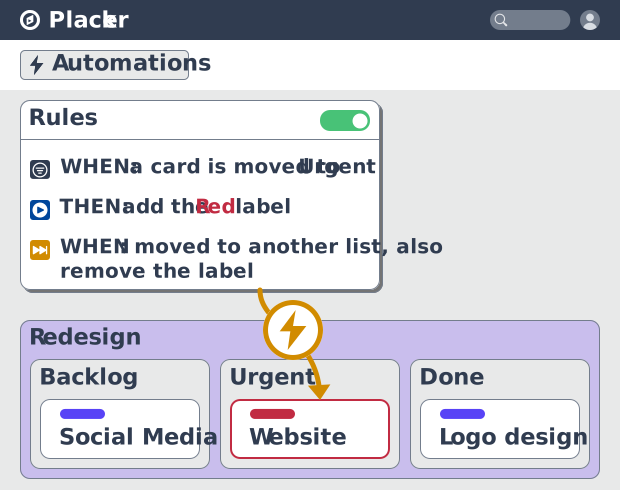
Project board automation rules, no-code
Automate project boards with condition-based rules. Placker mirrors, moves, assigns, and updates cards when work changes. See how it works.
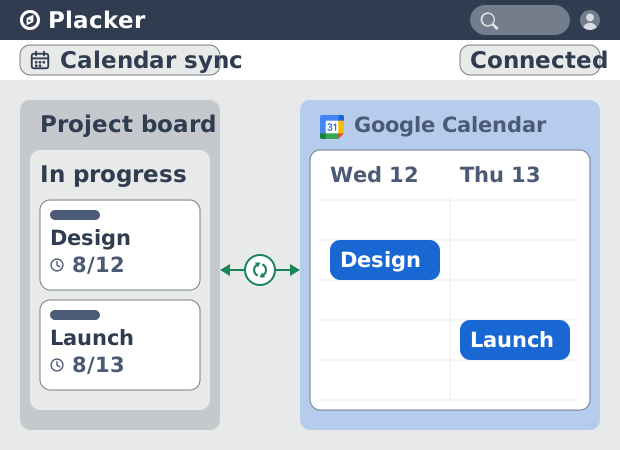
Placker Google Calendar sync: two-way, real-time
Placker syncs every dated card on your boards to Google Calendar, two-way, in under a minute. Edit either tool; both stay aligned. Start free.
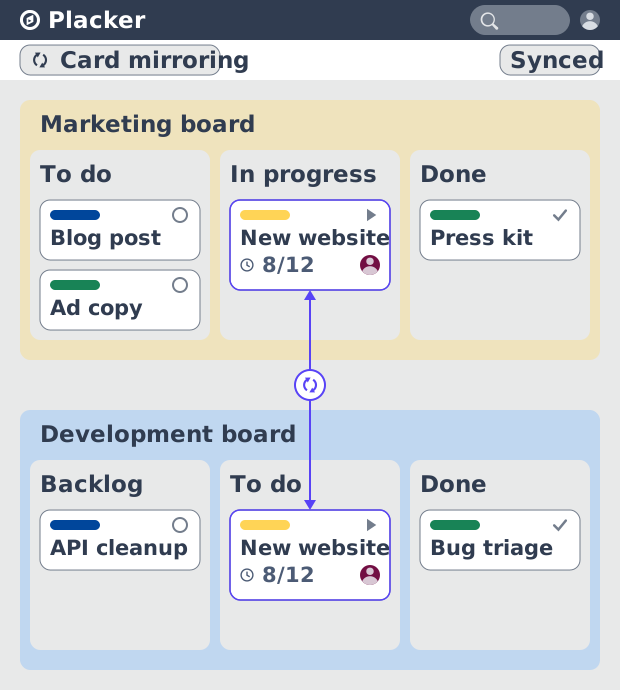
Card Mirror & sync in Placker: 2-way card sync
Card Mirror and sync keeps one task live across every Placker board. Edit a card once and status, dates and members update in seconds. Start a free trial.
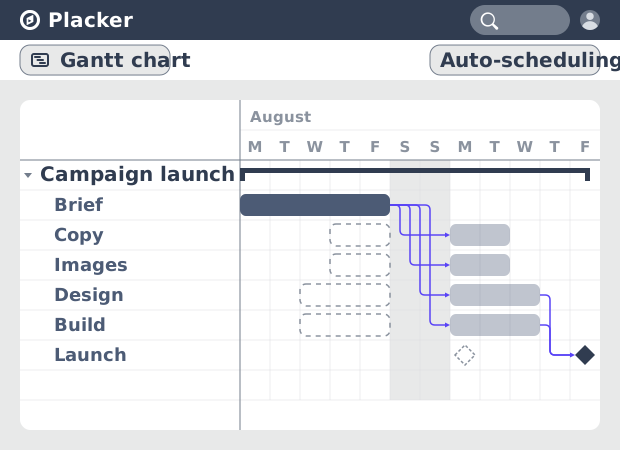
Auto scheduling software: Gantt with dependencies
Auto-schedule tasks with FS, FF, SS, and SF dependencies. Loose and Strict modes keep your plan dates accurate when upstream tasks slip. See how it works.
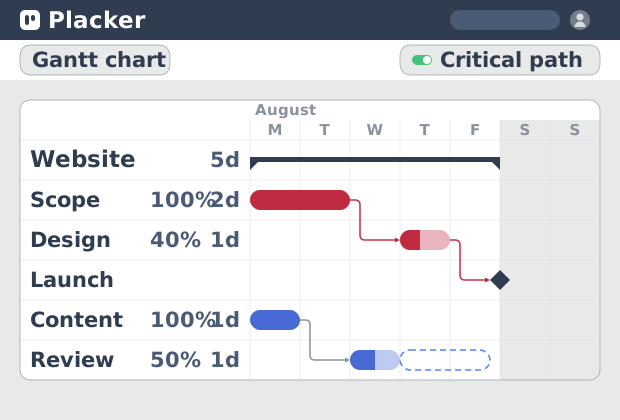
Critical path Placker: Gantt chart CPM analysis
Critical path in Placker finds the tasks that control your deadline and flags them on the Gantt, updating live as dependencies shift. Start a free trial.
Ready to get started?
Easy to setup, no credit card required, start your trial today!