Project dashboards and reports that never need rebuilding
A status spreadsheet goes stale the moment you paste it. Placker builds dashboards straight from your live project data, covering tasks, dates, assignees, and effort, and keeps them current as work moves. The report you share at nine still matches the plan at noon.
Quick facts
Reports in Placker
Live dashboards built straight from your cards. Here is what they give you:
- Always the live number. Dashboards read your cards directly, so statuses, due dates, assignees, and effort show the plan as it stands right now instead of the last export.
- Every board in one view. Combine multiple boards or projects into a single portfolio dashboard instead of checking each one separately.
- The widgets your review needs. Assemble KPI tiles, bar and line charts, pivot tables, card tables, doughnut and pie charts, and capacity views to match how your meeting runs.
- Delivered without the rebuild. Export any dashboard to PDF or schedule a recurring email so stakeholders receive the same numbers on a cadence, with no manual rework.
Live reporting
Project dashboards and reports on the plan as it stands
Your live task data, including status, dates, assignees, and effort, renders as charts. You stop maintaining a separate status spreadsheet that drifts from reality between updates. A delivery lead opens the same dashboard in a Monday review that the team worked in on Friday, and the numbers line up.
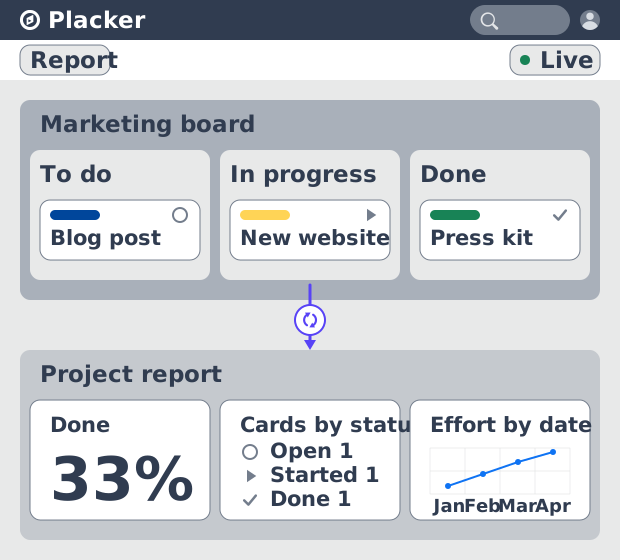
Portfolio view
Roll several projects into one portfolio view
That dashboard covers one project, but you can group projects so a single view spans a whole program or a client portfolio. A PMO sees which project is red without opening each one in turn. Portfolio reporting that used to mean a manual round-up at month-end becomes a view you open on demand.
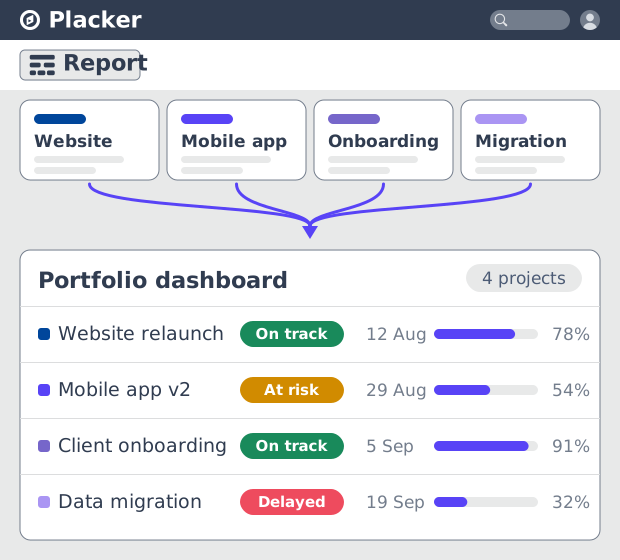
Widget library
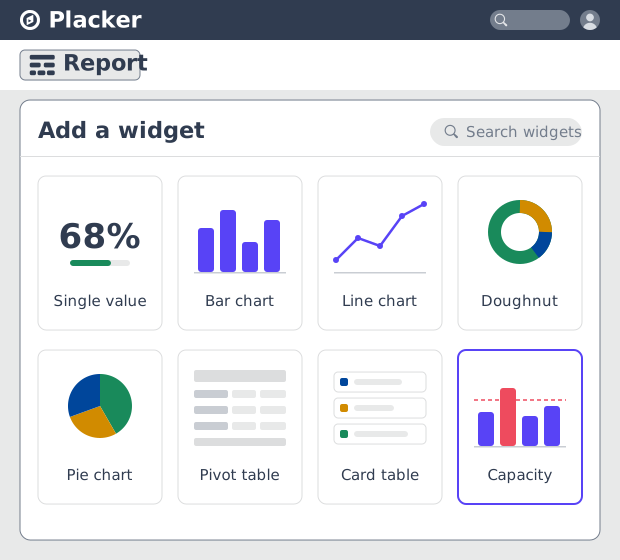
Match the widget to the metric
Those views are assembled from a widget library covering single-value tiles, bar and line charts, pivot tables, card tables, doughnut and pie charts, and capacity planning. You build the exact view a finance partner or an operations lead asks for, rather than forcing every metric into one chart. Capacity widgets show who is overallocated before the next assignment lands on them.
How It Works
Four steps from a project to a dashboard you can send.
- 1
Add your projects
Create projects in Placker or import existing work, so your tasks, dates, and assignees live in one place.
- 2
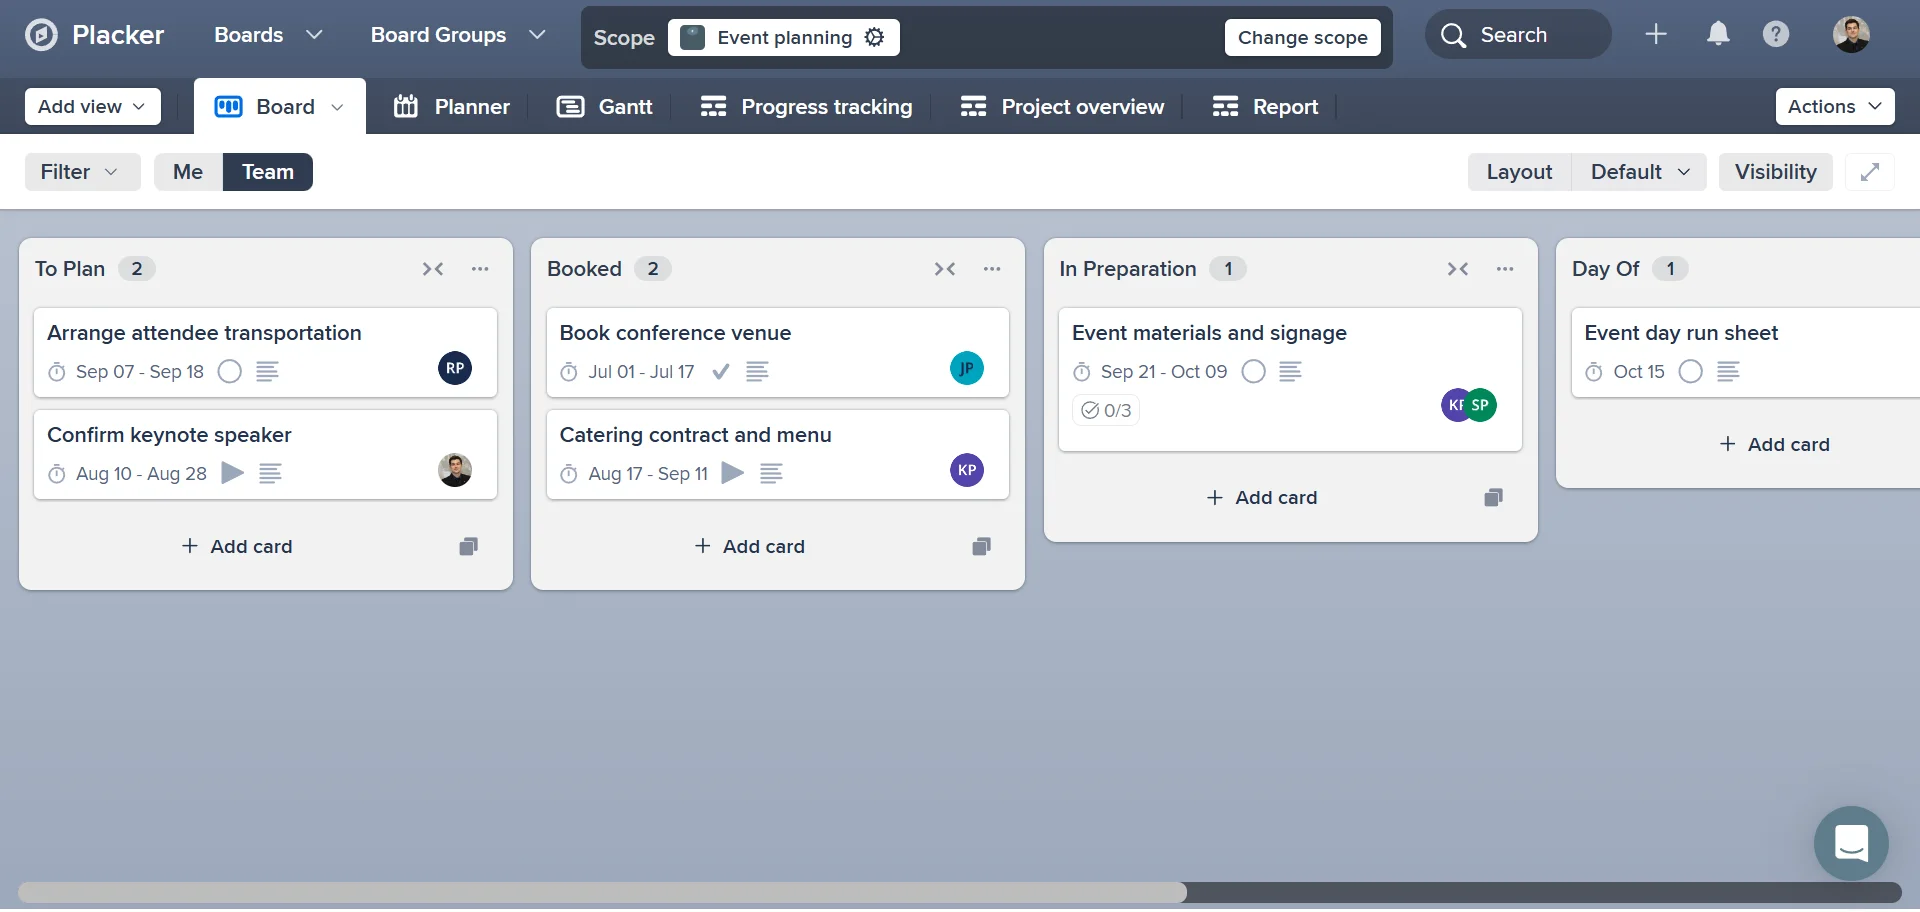
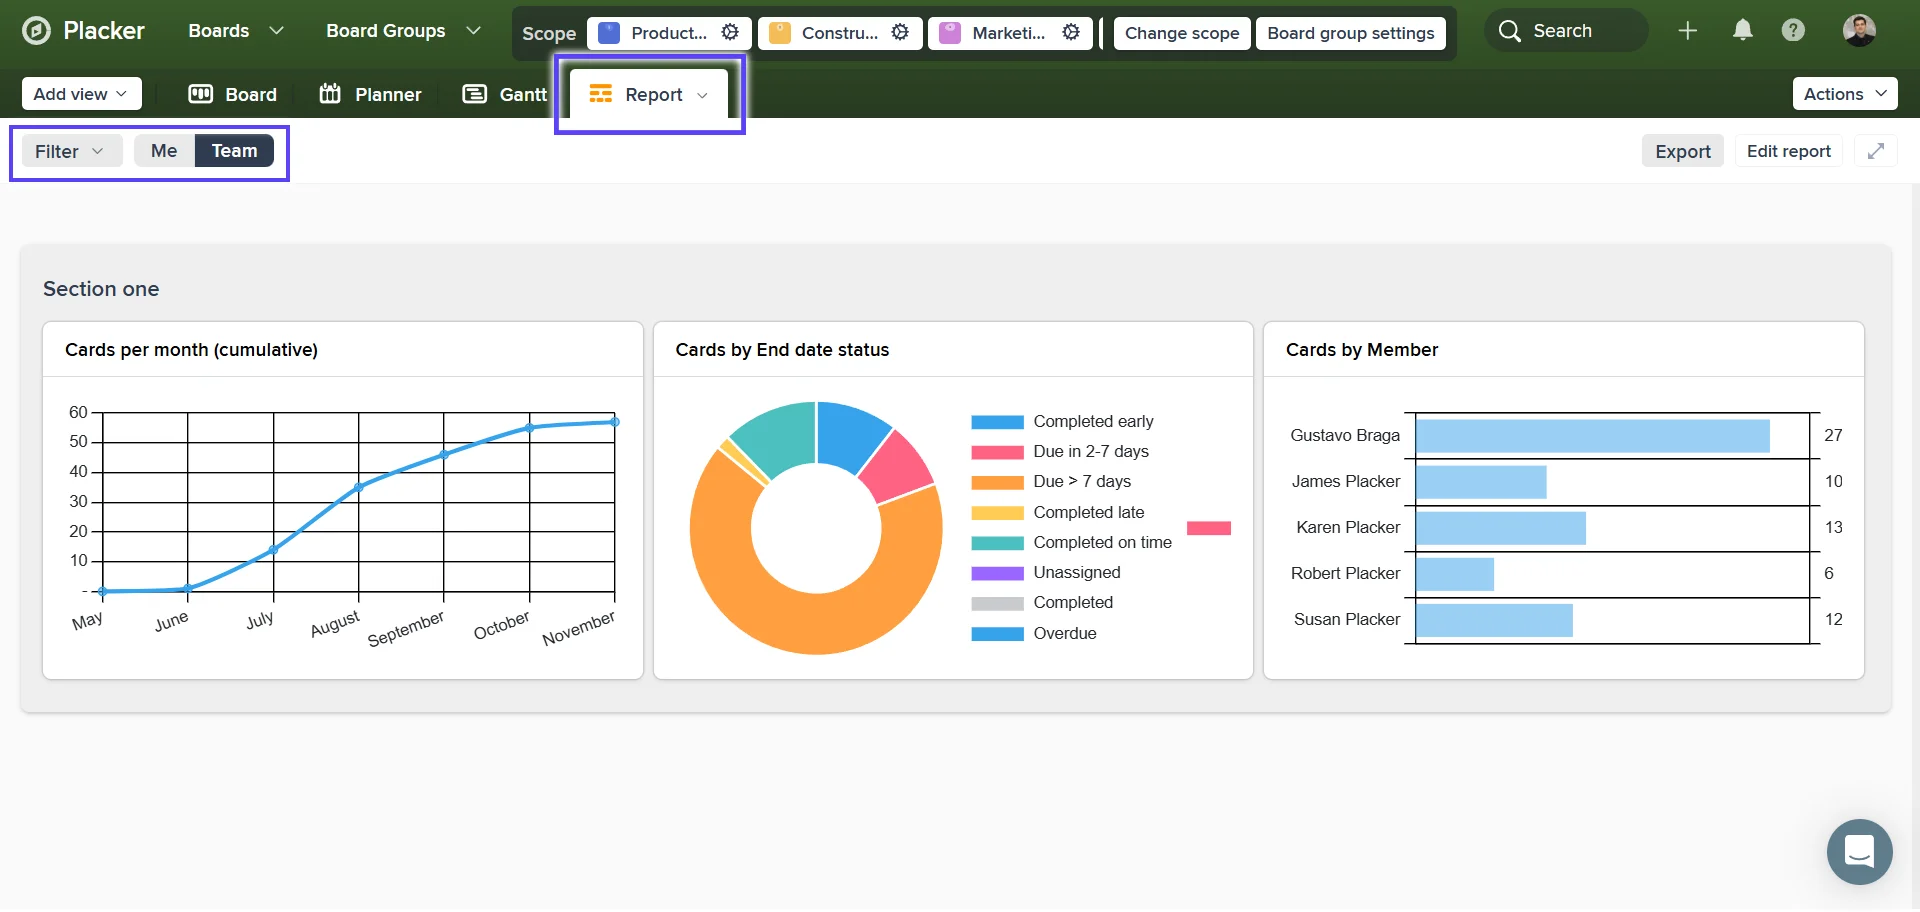
Open the Report view
From a project or a portfolio, open Report and start from the showcase layout.
- 3
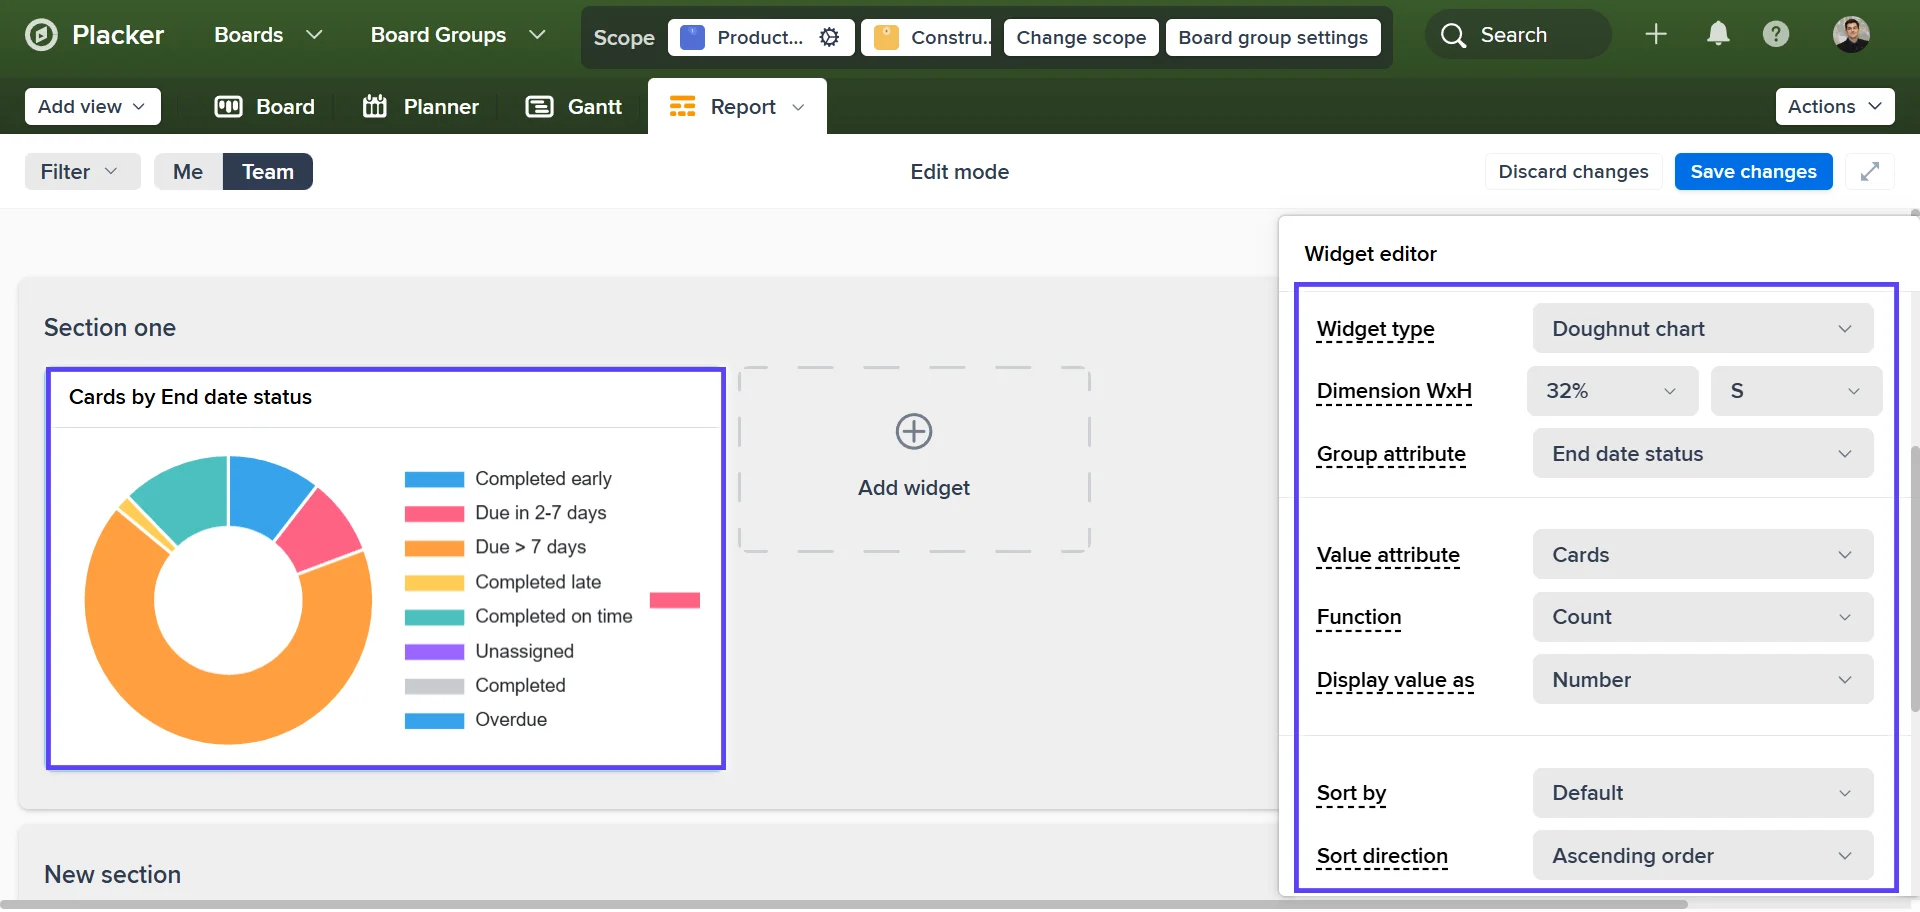
Build the dashboard
Add widgets, point each at a task field, and filter by status, assignee, or label to focus the view.
- 4
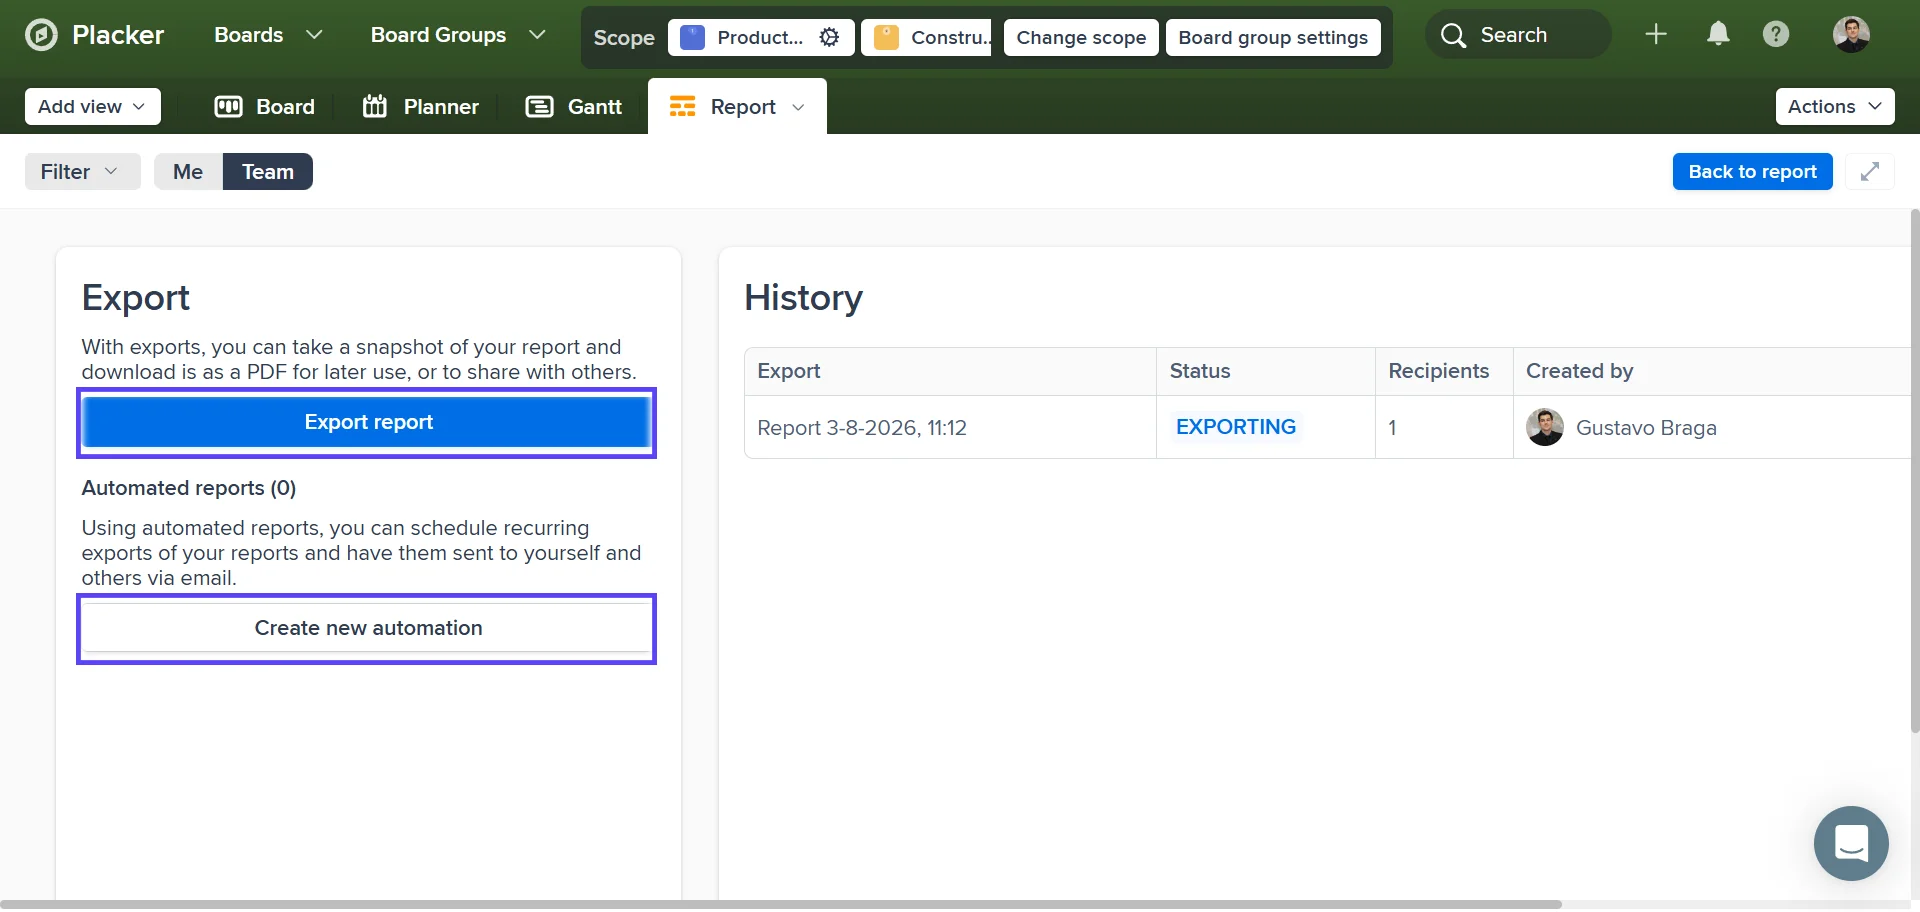
Share or schedule
Export to PDF, or set a recurring email under Automated reports so the report reaches your team or client on its own.
Use cases
See how teams use Placker's reports to track progress and make better decisions.
Agency delivery team
Runs a portfolio of client projects, with one dashboard per client and a weekly PDF that goes out without anyone assembling it.
Professional services lead
Tracks utilization with capacity widgets and effort by person, so the next engagement is staffed against real availability.
Internal operations team
Watches intake and throughput on a line chart to see whether the queue is growing faster than the team clears it.
PMO or portfolio owner
Reviews a program through traffic-light health across every project, and drills into the one that turned red.
Tips & Best Practices
Practical advice to get the most out of your workflow
Split tasks into child cards to sharpen your reports
Reports count every card, so breaking big tasks into Parent-Child Cards gives your dashboards finer-grained progress and workload data instead of one all-or-nothing line.
Filter reports by date range to review a sprint or project phase
Narrow your reports to a specific time window to get a focused view of how work progressed during a sprint, quarter, or any other period you care about.
Export your report to PDF or CSV to share with stakeholders
Share Placker reports with team leads or clients who need visibility without needing Placker access. PDF works great for presentations; CSV is perfect for further analysis in a spreadsheet.
Track progress over time by comparing consecutive reports
Run the same report in successive weeks or sprints and compare the results. Watching trends emerge over time is one of the most powerful ways to improve how your team plans and delivers.
Related pages
Gantt chart
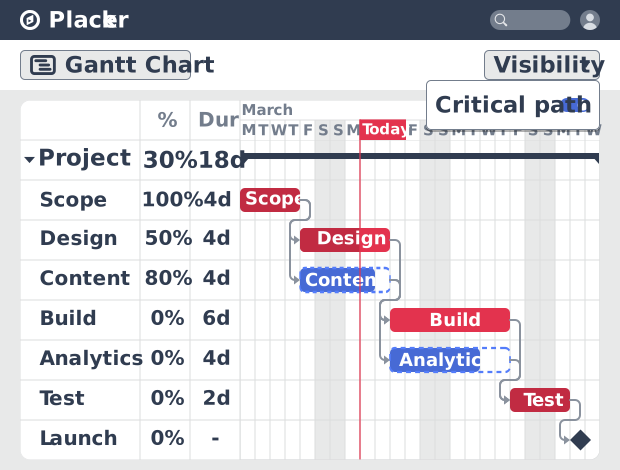
Plan projects on a visual timeline with Placker's Gantt chart software. Set dependencies, auto-schedule dates, and track the critical path.
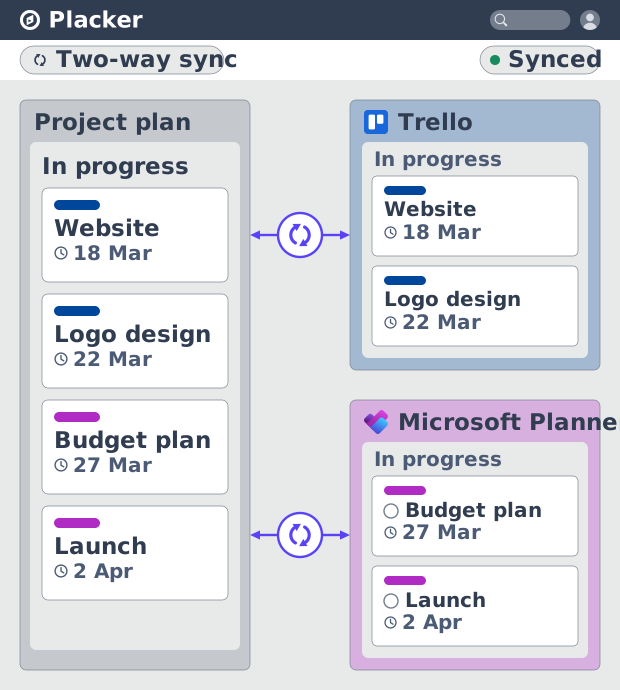
Placker integrations: sync your project tools
Placker integrations sync Trello, Microsoft Planner, Google Calendar, Clockify, and Zapier two ways, keeping one plan across every tool. See how it works.
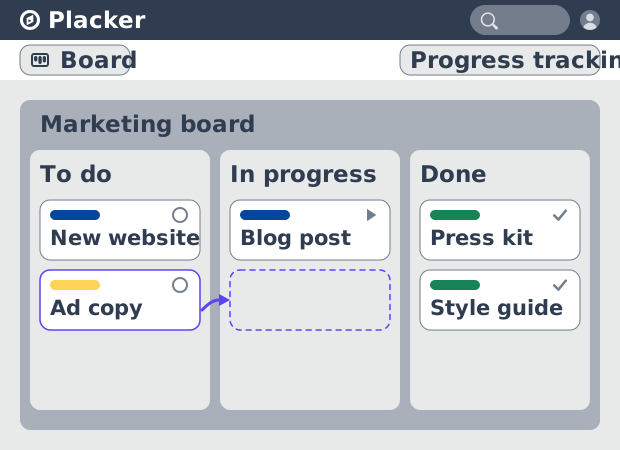
Board views: one board, any view
See all your work as cards moving across lists in Placker. Group by member, swimlane, or due date, and track flow with Kanban reports. See how it works.
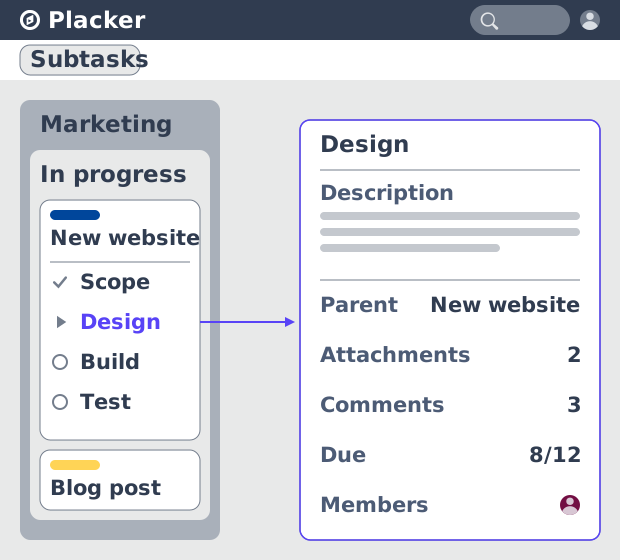
Parent-Child Cards in Placker | Subtasks that roll up
Parent-child cards in Placker give every subtask a full card and roll effort, dates and members up to the parent. Read the total on top.
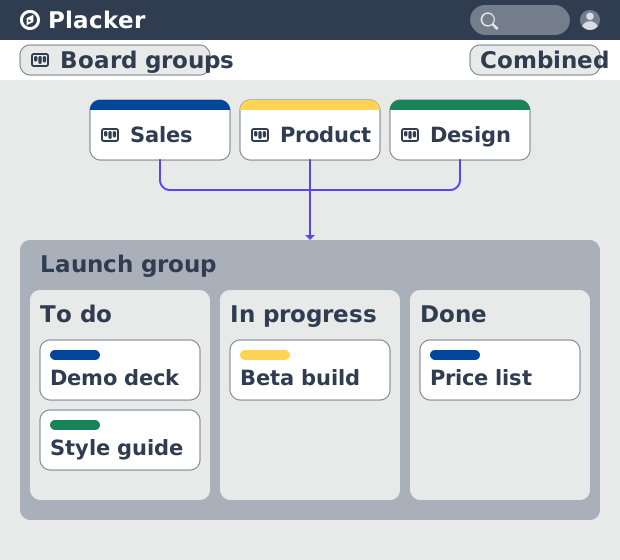
Board Groups: many boards, managed as one
Board Groups let you manage many boards as one workspace: plan, filter, and report across all of them, and save reusable groups. Start a free trial.
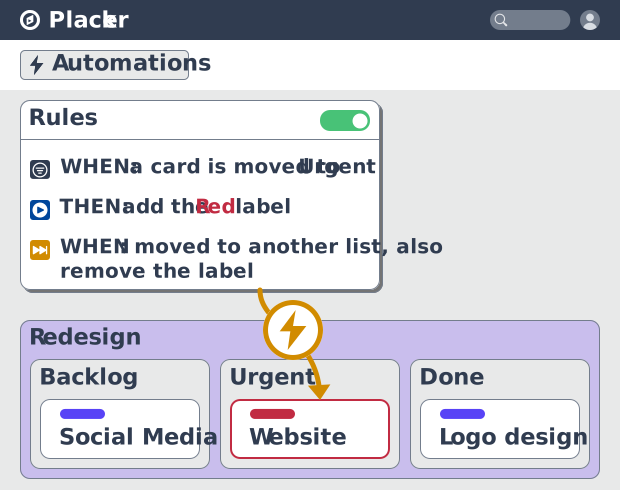
Project board automation rules, no-code
Automate project boards with condition-based rules. Placker mirrors, moves, assigns, and updates cards when work changes. See how it works.
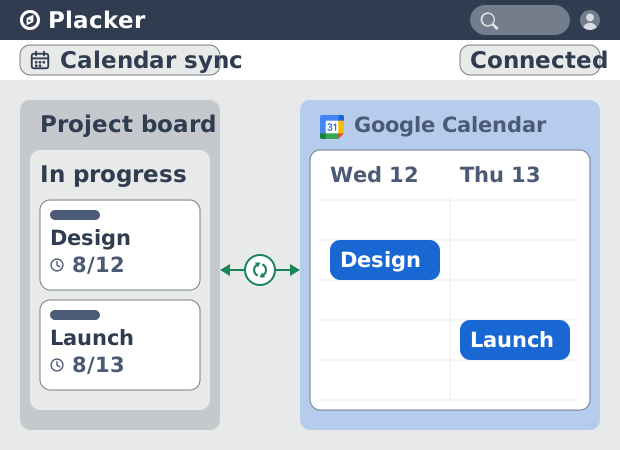
Placker Google Calendar sync: two-way, real-time
Placker syncs every dated card on your boards to Google Calendar, two-way, in under a minute. Edit either tool; both stay aligned. Start free.
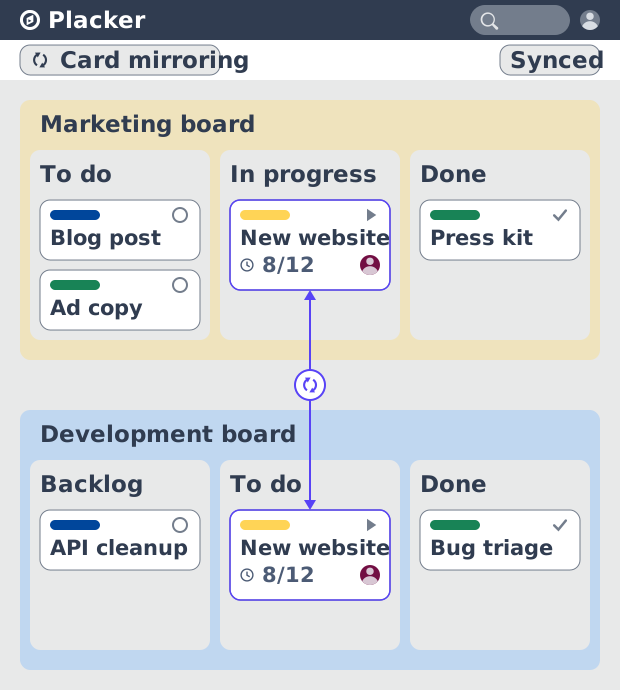
Card Mirror & sync in Placker: 2-way card sync
Card Mirror and sync keeps one task live across every Placker board. Edit a card once and status, dates and members update in seconds. Start a free trial.
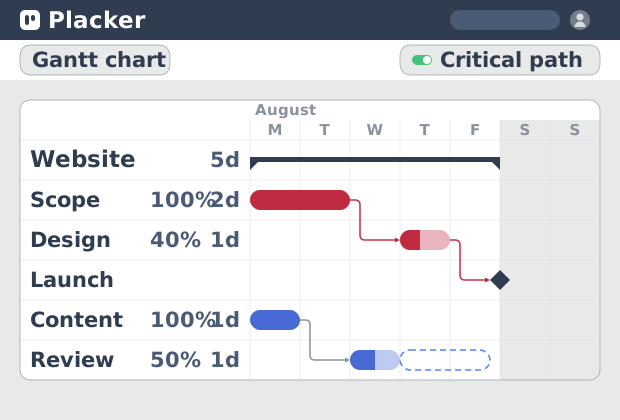
Critical path Placker: Gantt chart CPM analysis
Critical path in Placker finds the tasks that control your deadline and flags them on the Gantt, updating live as dependencies shift. Start a free trial.
Ready to get started?
Easy to setup, no credit card required, start your trial today!