Turn your plans into a Microsoft Planner Gantt chart
Placker reads your Microsoft Planner tasks and renders them as a real Gantt chart, adding the dependencies, critical path, and resource view that Planner's board and grid leave out. Buckets group your tasks and the grid sorts by date, but neither shows how the work connects or which slip pushes your launch.
Quick facts
Gantt Chart for Microsoft Planner
Your Microsoft Planner tasks on a real timeline, built from the plan you already have:
- Built from the plan you already have. Placker syncs with Microsoft Planner and turns each task into a bar on the timeline.
- The dependencies Planner cannot draw. Link tasks with real predecessor-successor dependencies that Planner has no way to model.
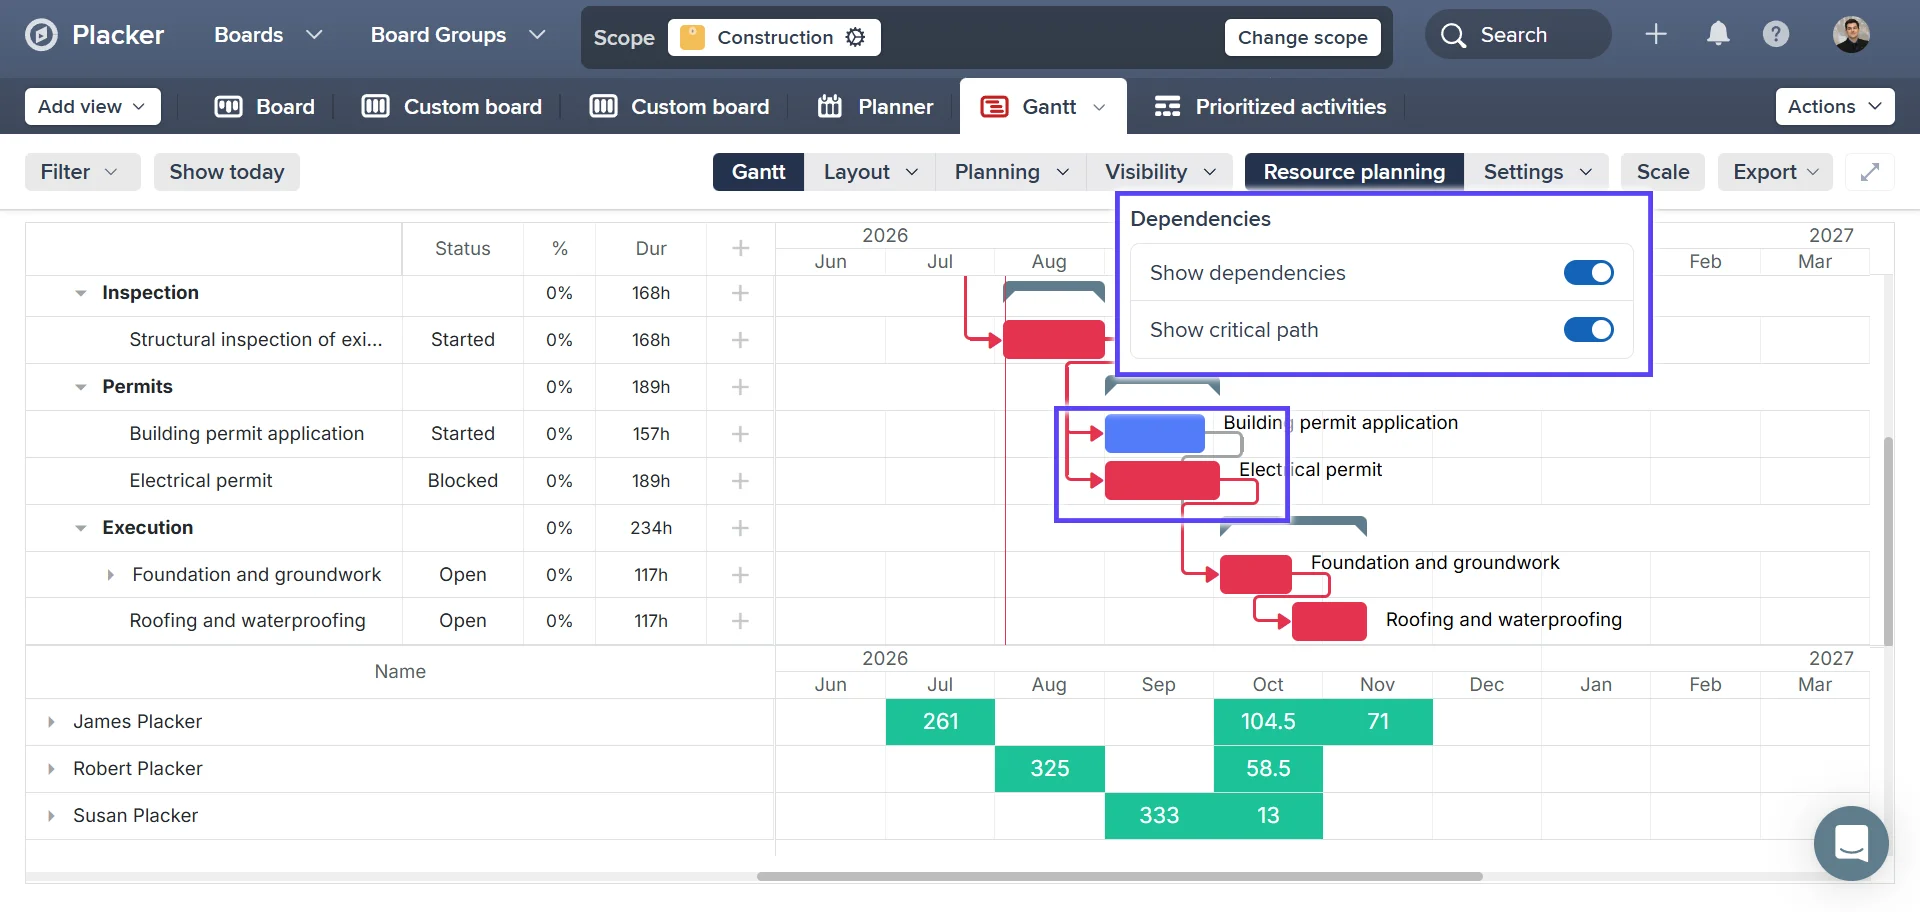
- See what decides your finish date. Show the critical path to spot the tasks that set when the plan ends.
- Measure drift against a baseline. Save a baseline and compare today's schedule against the original at a glance.
- Many plans, one Gantt view. Bring tasks from several plans together with cross-plan dependencies and a shared resource view, then export to PDF or PNG.
Dependencies
See how your Microsoft Planner Gantt chart connects tasks
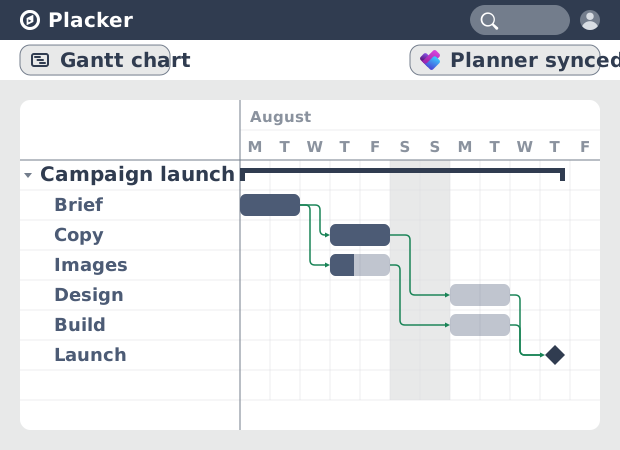
In the Gantt view you draw a dependency by dragging from one task bar to the next, so a task starts only after the one before it finishes. When a date moves, auto-scheduling shifts every linked task for you, rather than making you reopen each Planner task and retype dates. A slip in week one then shows up immediately as a new finish date, not as a surprise at the next check-in.
Resource planning
Balance workload across your team
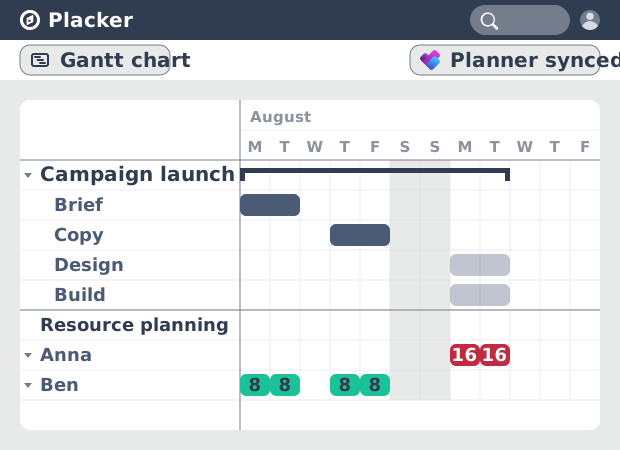
A finish date only holds if the people behind it are not already overloaded. The resource planner reads the assignments on your Planner tasks and plots hours per person along the timeline. You can see who is booked past capacity in a given week before you commit to a deadline, which the Planner grid never surfaces. Move or reassign a task and the workload updates, so the plan you approve is one your team can deliver.
Critical path
Plan a program across several Planner plans
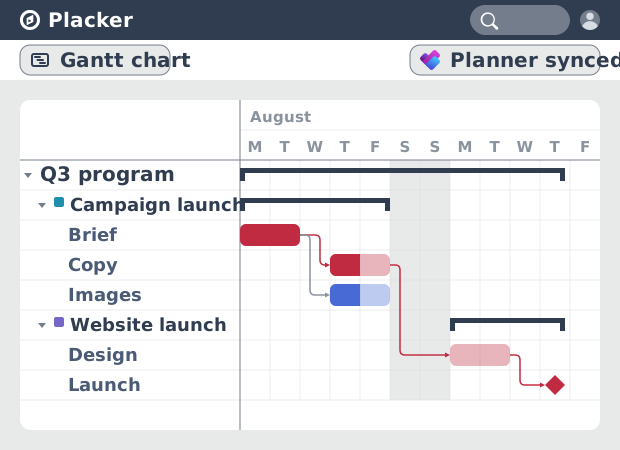
That deliverable plan is usually one piece of something larger, and large initiatives rarely live in one plan. Bring tasks from several Microsoft Planner plans onto one Gantt timeline, with dependencies that cross from one plan to another. Turn on the critical path and you see the exact chain of tasks that sets the end date across all of them, so you know where to protect the schedule and where there is slack.
How It Works
Connect your Microsoft Planner plan, set start and due dates on tasks, link tasks into a sequence, then share the timeline or export it.
- 1
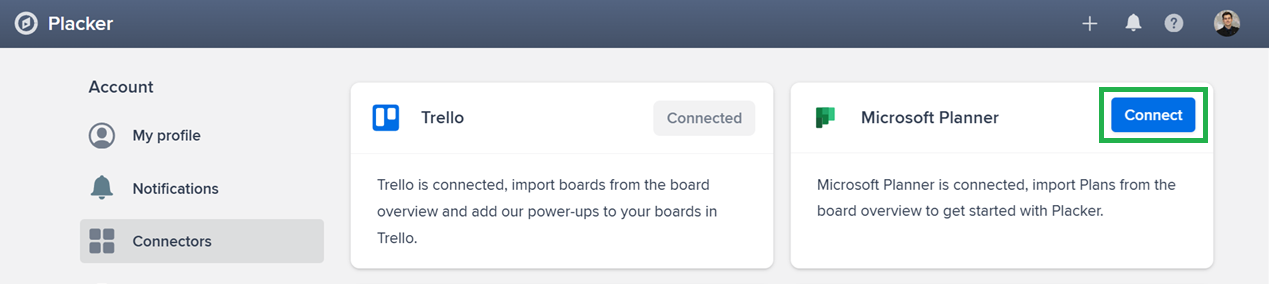
Connect your Microsoft Planner plan
Connect the plan you want to schedule. Placker imports its buckets and tasks, keeping assignments and due dates intact.
- 2
Set start and due dates on tasks
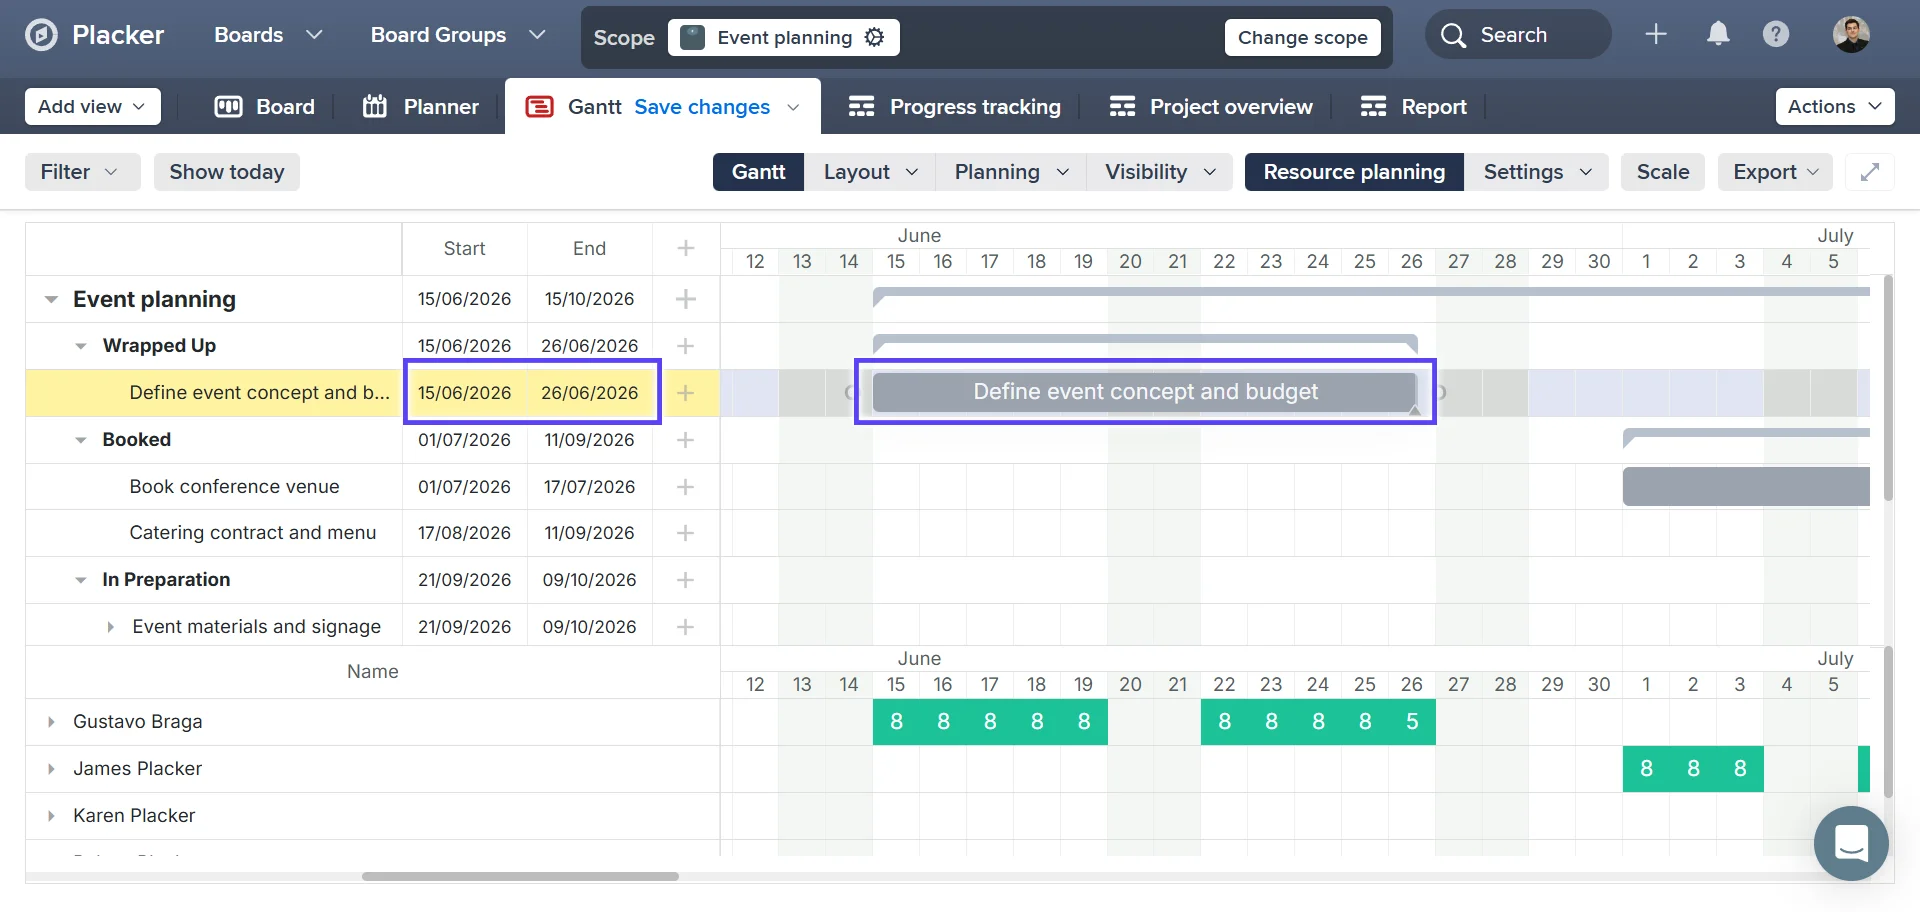
Open the Gantt view and give each task a start and due date by dragging the ends of its bar. Duration is calculated between the two, skipping weekends and holidays set in the board calendar.
- 3
Link tasks into a sequence
Drag from the circle on one task bar to another to create a predecessor link. Turn on auto-scheduling so dependent tasks move automatically when a date changes.
- 4
Share the timeline or export it
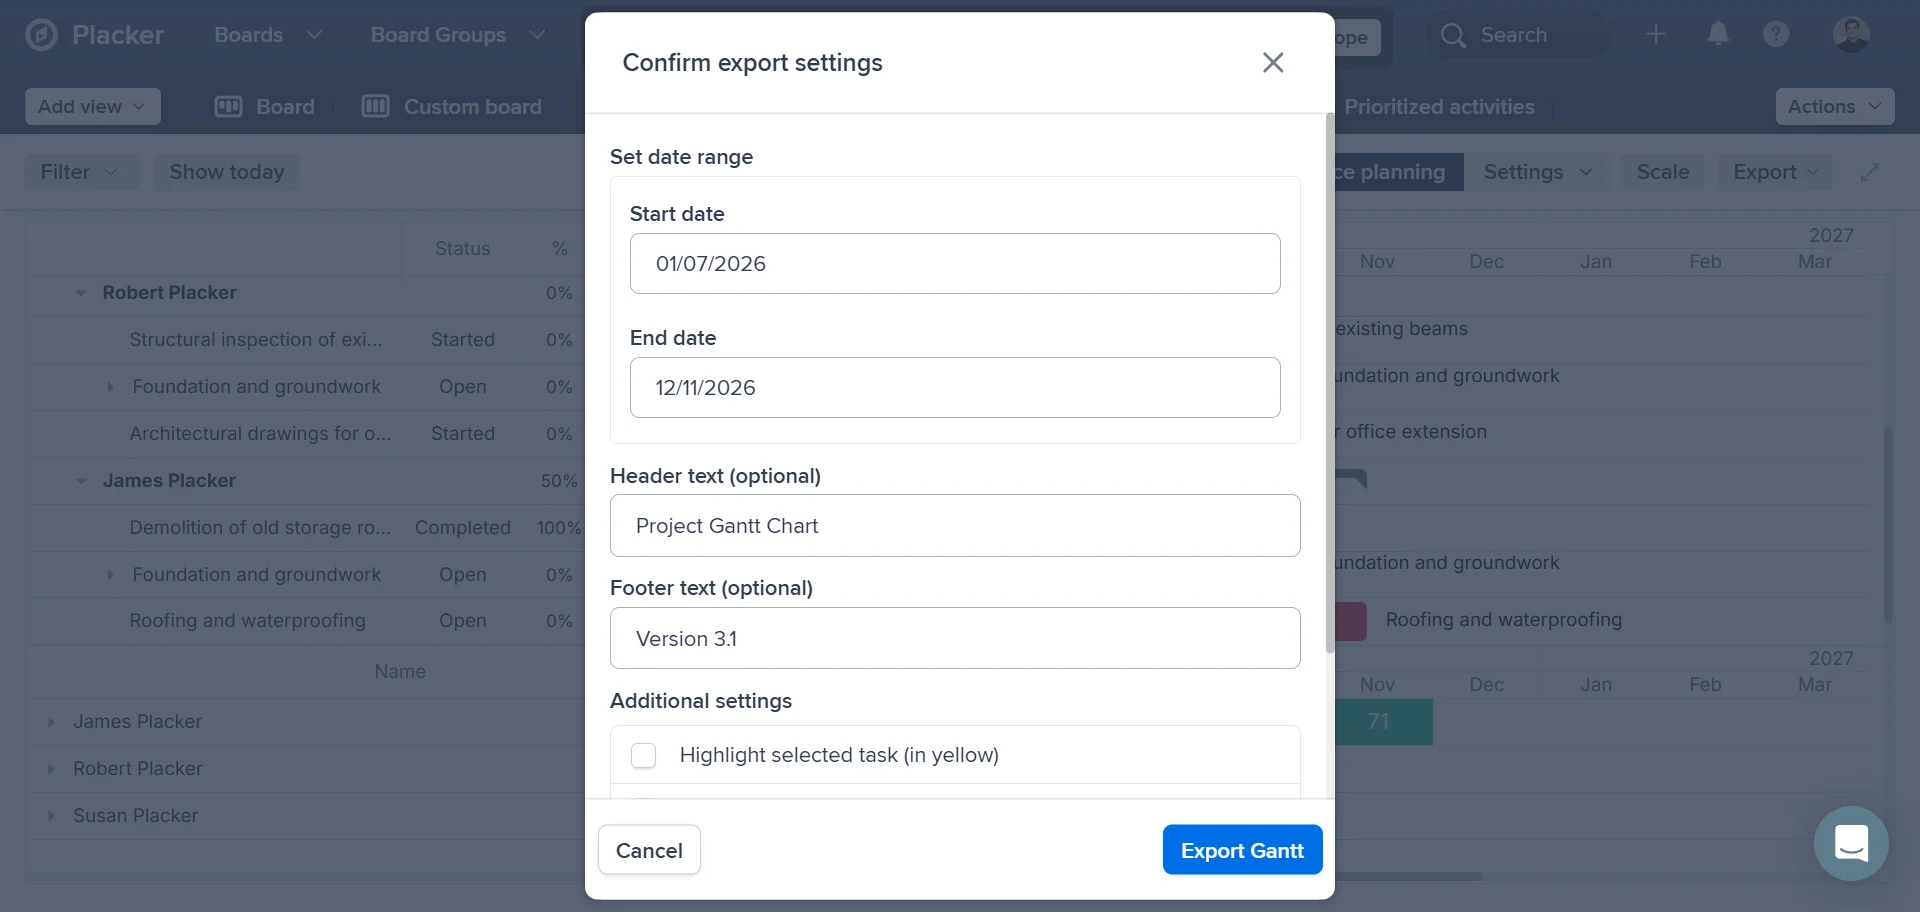
Show the critical path, then share a live Gantt view with your team or export it to PDF or PNG for a status report.
Use cases
How IT, PMO and delivery teams schedule their Microsoft Planner work once buckets and due dates stop being enough.
IT rollout managed in Microsoft 365
An IT project manager coordinates a laptop rollout across four sites, with the work tracked in a Planner plan tied to a Microsoft 365 group. Buckets show the stage each site is in. They do not show that imaging cannot start until procurement lands, so on the Gantt timeline the manager links those tasks in order and turns on the critical path. When a shipment slips a week, the timeline shows which sites move with it and which still have slack, so the go-live date they commit to is one the team can hold.
PMO reporting across departments
A PMO lead reports on work that sits in five separate Planner plans, one per department, and leadership wants a single schedule each month. Instead of rebuilding it in a spreadsheet, they bring the plans onto one Gantt timeline and save a baseline at the start of the quarter. The steering pack then shows current dates against the plan that was agreed, not a status field someone updated by hand. Exporting the timeline to PDF is the last step before the meeting.
Resourcing a shared delivery team
A delivery manager runs one team across three client plans in Planner. Each plan looks reasonable on its own. On the Gantt timeline the assignments from all three land under the same bars, and the workload row shows the designer committed twice over in the week the second client's build starts. Dragging that phase out by four days moves the dependent tasks with it, and the start date the manager promises does not depend on pulling the designer off the other two clients.
Tips & Best Practices
Practical advice to get the most out of your workflow
Add start and due dates in Microsoft Planner to see your Gantt
Placker pulls your Microsoft Planner task dates into the Gantt view automatically. The more tasks you have with dates, the richer and more useful your Gantt timeline becomes.
Zoom in and out to match your planning horizon
Switch between daily, weekly, and monthly views in Placker's Gantt to get the right perspective on your Microsoft Planner tasks. Weekly view is ideal for sprint planning; zoom out for a portfolio roadmap.
Group tasks by bucket to organise your Gantt
In Placker's Gantt, group your Microsoft Planner tasks by bucket to separate project phases or workstreams on the timeline. Each bucket gets its own section for a clear, structured view of the whole project.
Track plan-vs-actual with Reports
Your Gantt shows the plan; add Reports to see how many Microsoft Planner tasks are on time, slipping, or done across that same timeline. Build the schedule first, then pair with Reports to watch whether you're actually hitting it.
Related pages
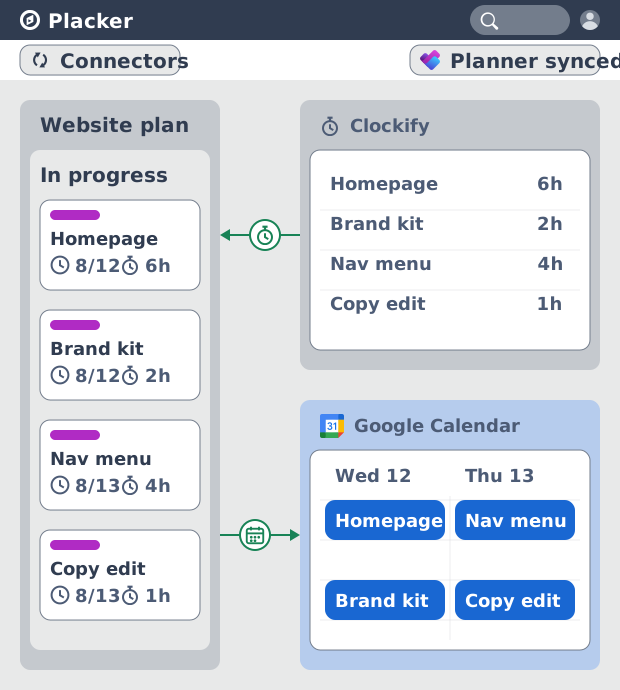
Microsoft Planner integrations: two-way sync
Sync Microsoft Planner plans two ways with Placker and add the calendar, time tracking, and automation Planner lacks. See how it works.
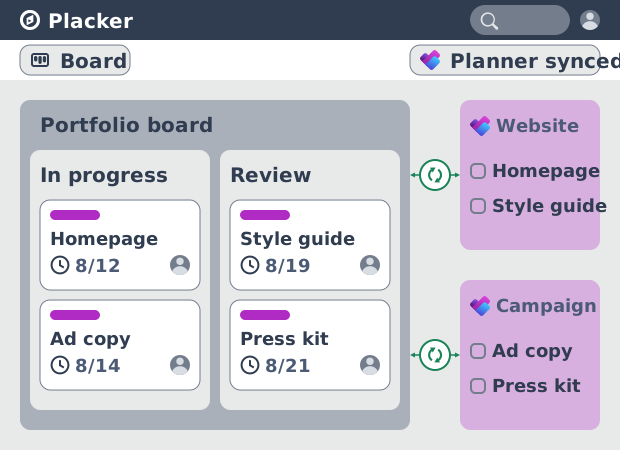
Microsoft Planner board view: layouts and reports
Add custom grouping, swimlanes, and Kanban reports to your Microsoft Planner board view. Placker reads your plans, no rebuild. Start a free trial.
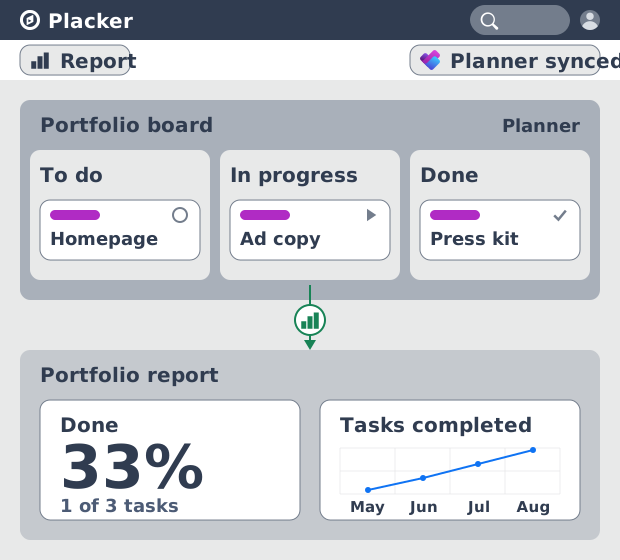
Microsoft Planner dashboards & reports
Report across Microsoft Planner plans without Power BI. KPI widgets, pivot tables, portfolio dashboards, and scheduled PDF reports. Start a free trial.
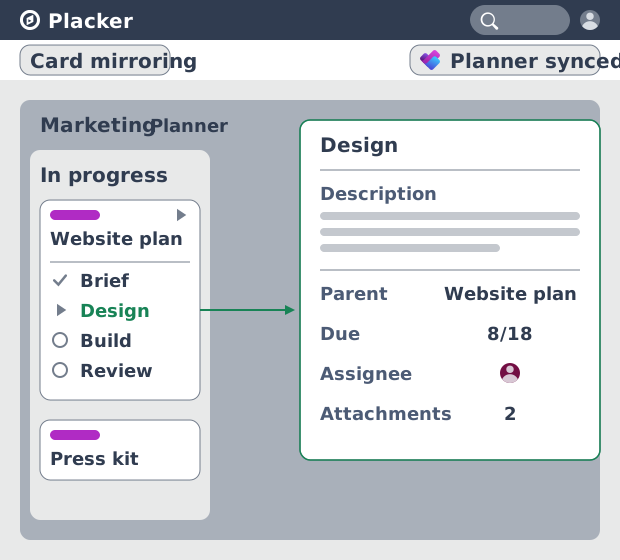
Subtasks in Microsoft Planner: Parent-Child Tasks
Add real subtasks to Microsoft Planner without premium. Parent-child tasks give each subtask an assignee and dates, and roll effort up.
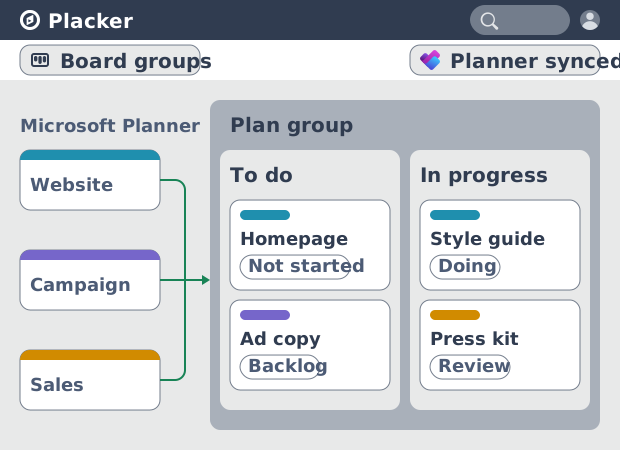
Microsoft Planner: see many plans in one view
See tasks from several Microsoft Planner plans in one board view, no Project Plan 3 or 5 license needed. Placker works on every tier. See how it works.
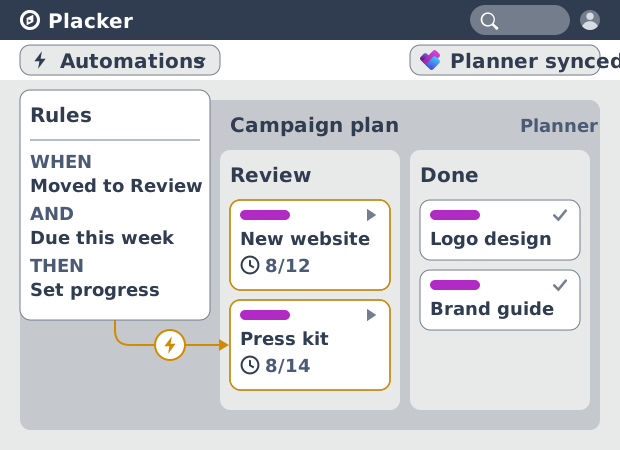
Microsoft Planner automation, no Power Automate
Add conditional automation to Microsoft Planner without Power Automate. Placker runs visual rules on your plans and tasks, plus recurring cards. See how.
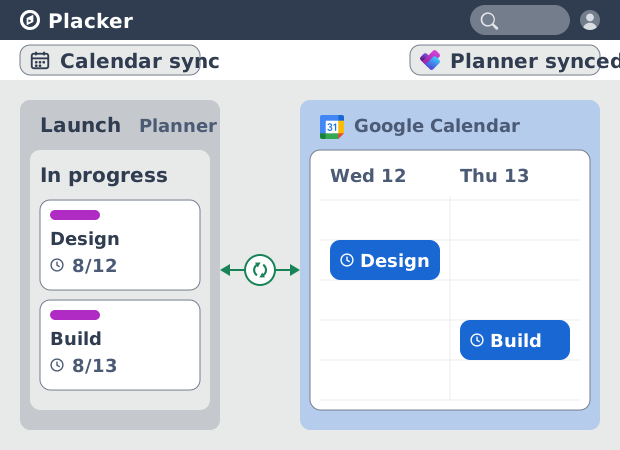
Microsoft Planner Google Calendar sync (2-way)
Microsoft Planner has no native Google Calendar sync. Placker syncs your tasks to Google Calendar, both ways, in minutes. Start free trial.
Ready to get started?
Easy to setup, no credit card required, start your trial today!