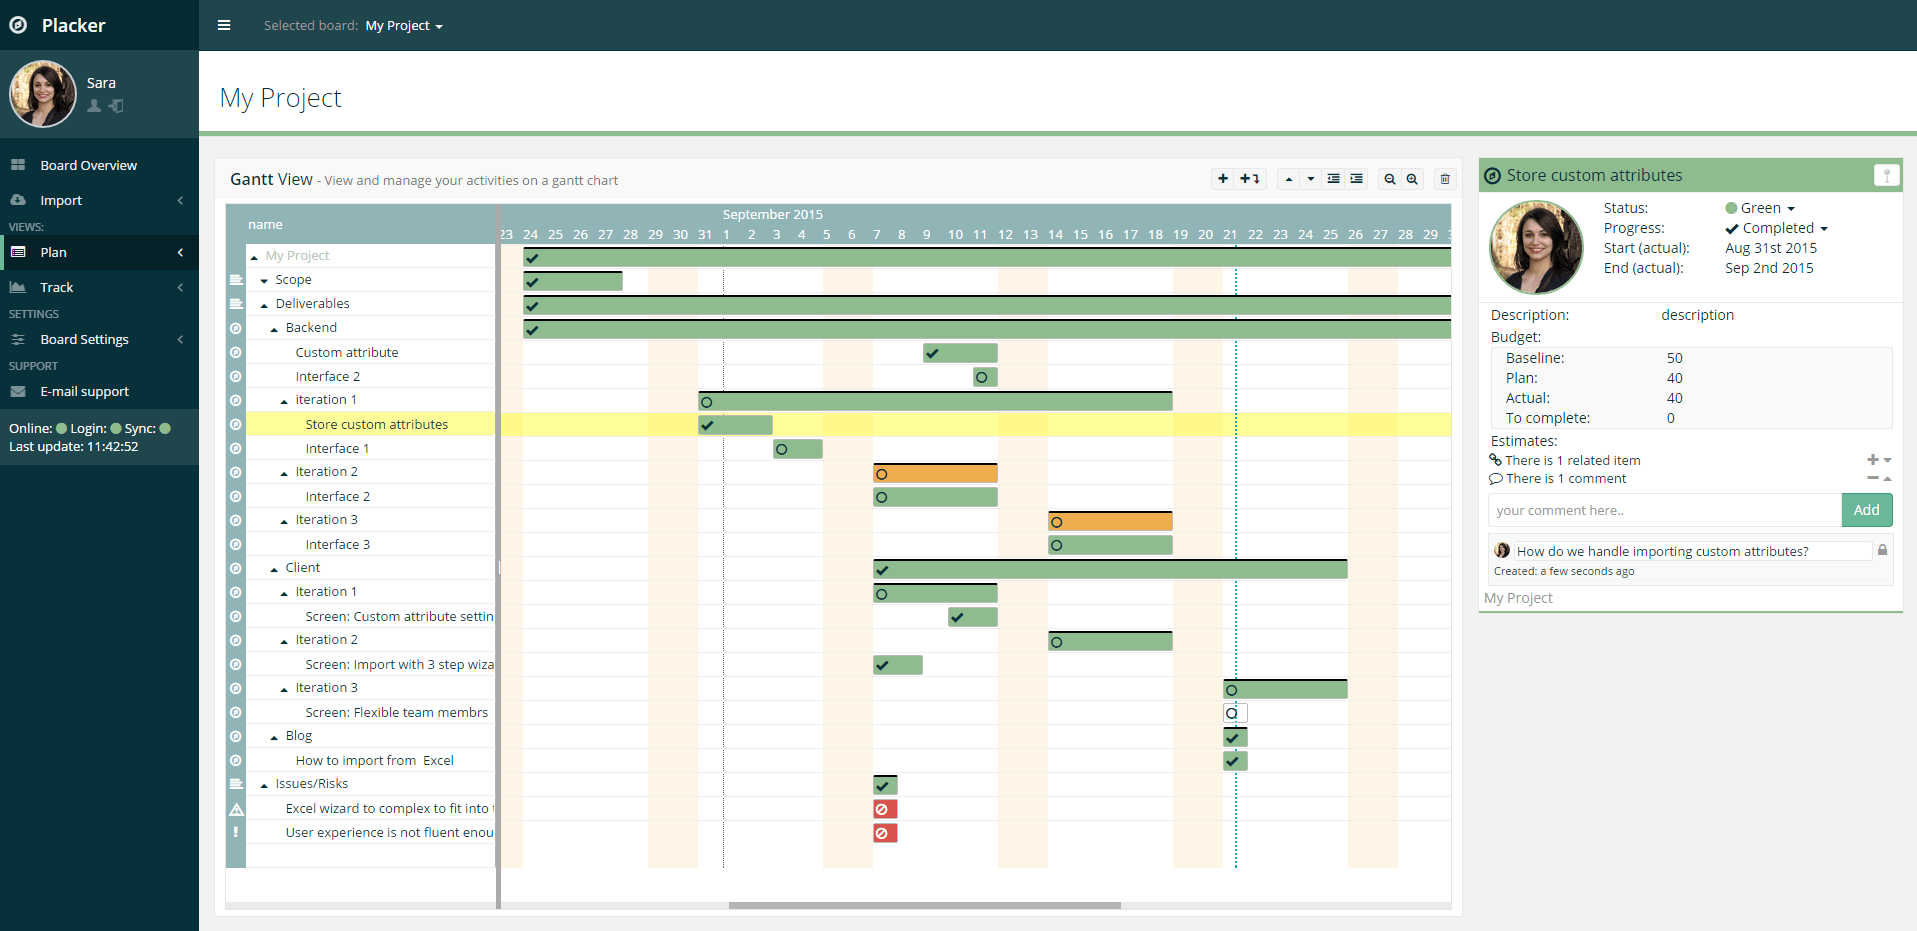
Gantt charts - view cards in time.
A gantt chart is a popular way to show your cards against time. Gantt charts help you to understand things like how your cards are planned over time, how many cards overlap and the duration of the overall board. This chart will be generated based on your card's due date, you can also set the start date in Placker to change the duration of a card. The start date will be stored in placker, the end date will be synchronized with Trello.
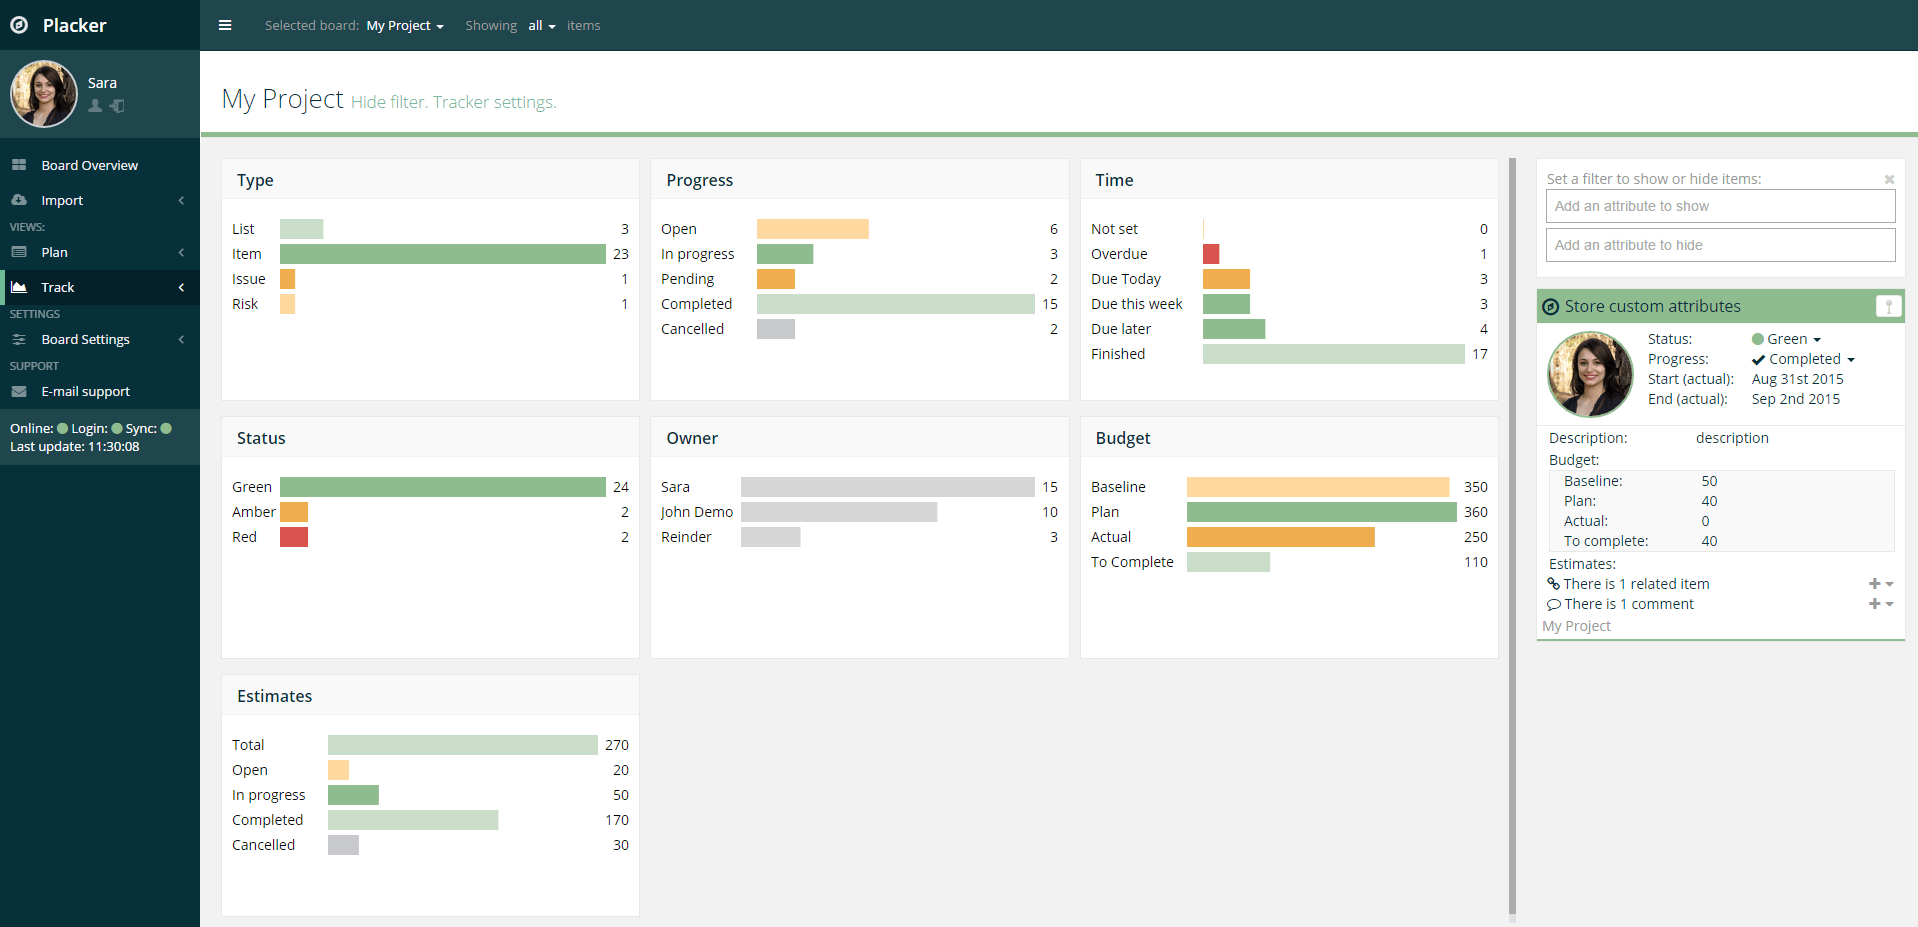
Bar charts - understand your current status
Bar charts are a way to compare the number of cards against a card attribute. Each attribute value will be plotted in a bar, the longer the bar, the bigger the value. Bar-charts will help you to understand the status of your cards against its attributes at a glance. By default placker will generate a bar-chart for Owner (who is assigned to what cards), Timeliness (when are cards due), Progress (how are cards progressing). You can create your custom attributes if you need to, common custom attributes are Budget (to track your budget) and Estimates (to track estimate burn down).
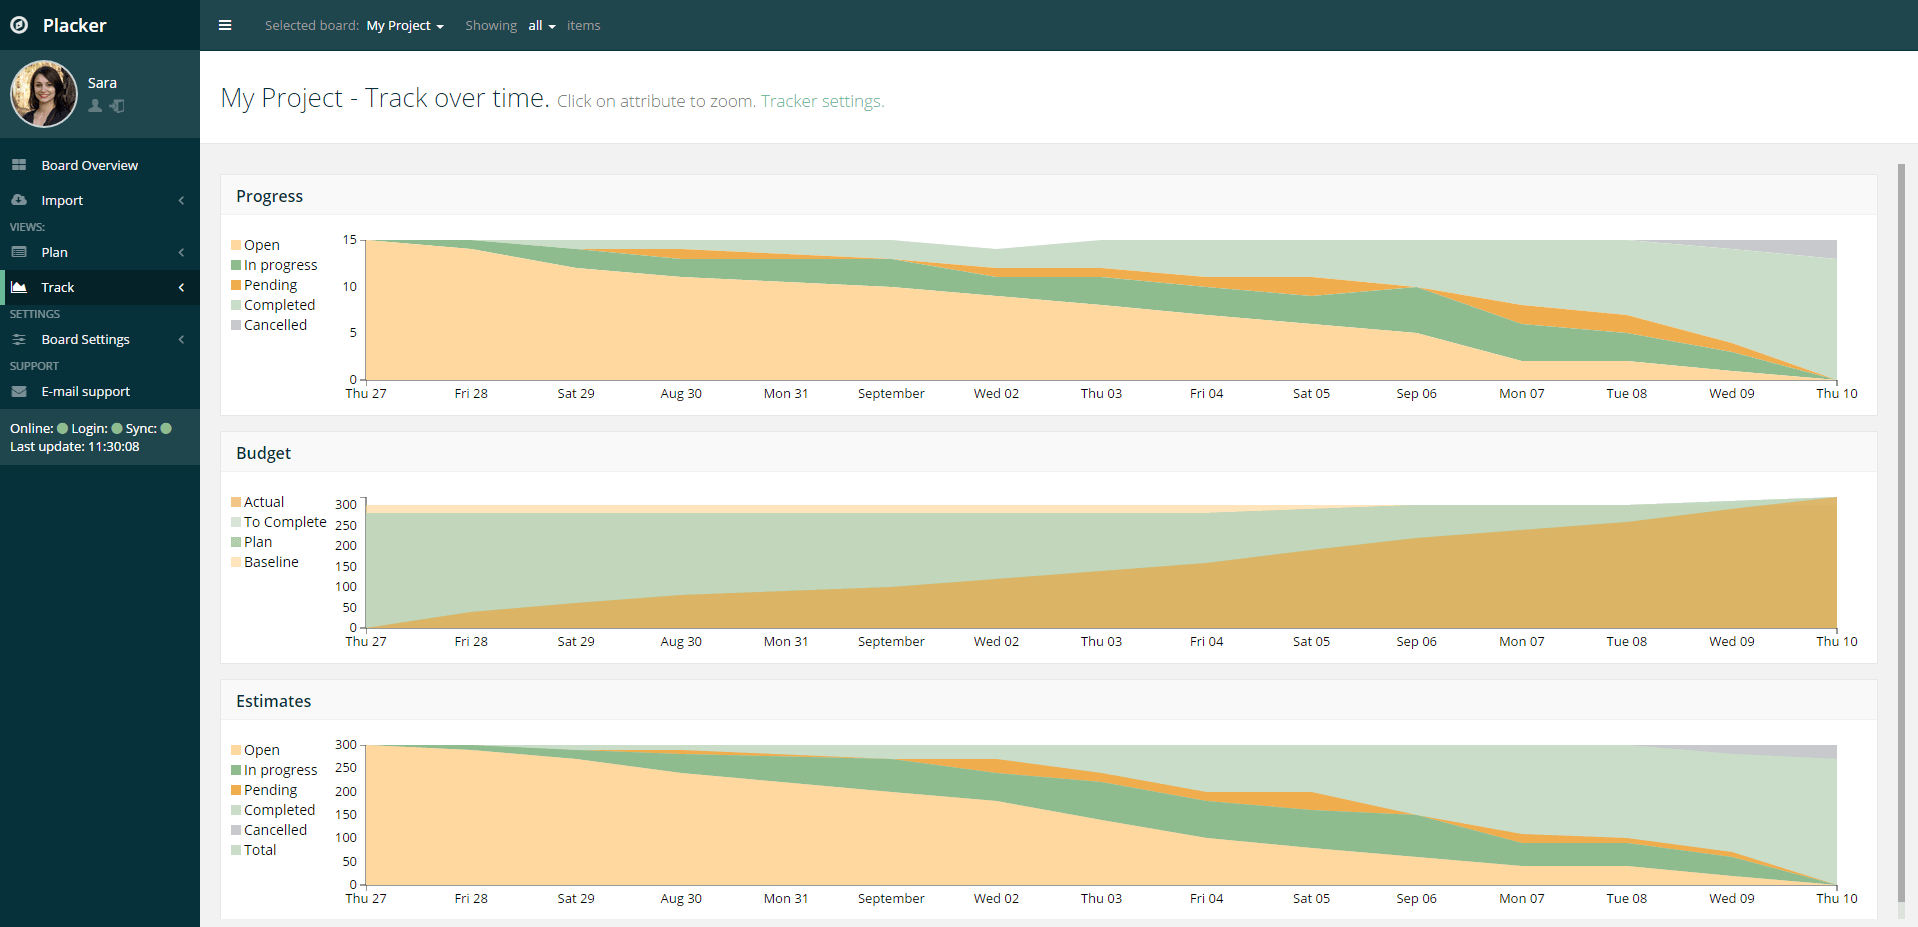
Trend charts - understand your status over time
Trend-charts are line or area charts where data is plotted against time. Where bar-chart represent the real-time status of the attributes, trend-charts represent the trend of the attributes over time. Trend charts are a great way to understand how your cards are developing. A popular trend chart is the burndown chart where the estimated effort is tracked against the status of the cards. Trend-charts in placker are build over time, every 12 hours a reporting snapshot is taken from your board that feeds your report.
Find out yourself
Start your trialVery simple to get started
 1. Sign up
Sign up using your Trello account.
 2. Import boards
Select the boards you want to import. (we also keep it synchronized)
 3. Access data
Your Gantt, Dashboards and reports are available immediately.
Trusted by thousands managing millions of tasks
Boards
Members
Cards